Contents
- Native and managed leaks in C++ and .NET
- How to add a memory analyzer to Visual Studio?
- How do I see allocated memory in Visual Studio?
- Conclusion
How to analyze memory usage in Visual Studio?
Native and managed leaks in C++ and .NET
Sooner or later, every developer experiences the situation when a program crashes, consuming all available memory. A .NET application throws OutOfMemoryException, C++ code throws std::bad_alloc , C functions malloc and calloc return NULL. All of them are signs of a memory leak. Both managed and unmanaged code can have leaks.
An unmanaged or a native code allocates and frees memory explicitly. If a developer forgets to call free, a leak will appear. While a native code has full control over allocations, a managed code (for example, written in C# or VB.NET) doesn’t allocate memory directly. Instead, a .NET runtime allocates memory for objects, and keeps an object in memory if there are references to it. When there is no reference to an object, it is not required anymore and will be marked for deletion. This process is called garbage collection. Sometimes, objects have references that are unexpected for a developer; this leads to leaks.
In order to find and fix leaks, developers need to use appropriate instruments. A memory profiler is a tool to analyze memory, allocated by a process that helps to find the source of memory leaks.
In this article, we will show how to install a Visual Studio memory analyzer, called Deleaker.
How to add a memory analyzer to Visual Studio?
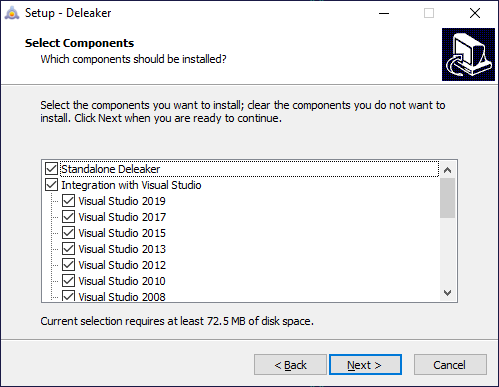
Deleaker is available for downloading on the official web-site. Run the installer, choose Visual Studio versions you want Deleaker to be integrated to:
Once the installation is done, run Visual Studio. The new menu entry Extensions – Deleaker appears:
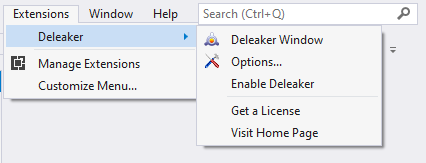
Deleaker is currently disabled. You can open a project and start debugging as usual. If you want to turn on the memory analyzer, click to Extensions – Deleaker – Enable Deleaker. Now Deleaker is ready to cooperate with Visual Studio’s debugger to collect information about allocations and capture a call stack for each of them.
Let’s create a sample with memory leaks. We will show how Deleaker finds leaks providing complete information, including a certain source file and line number.
How do I see allocated memory in Visual Studio?
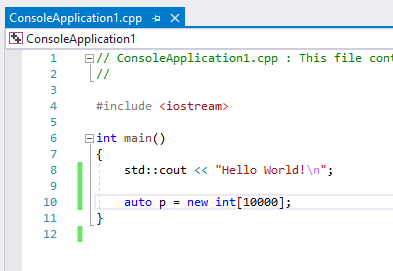
We create a C++ Console App project and add an intentional leak made by the usual operator new:
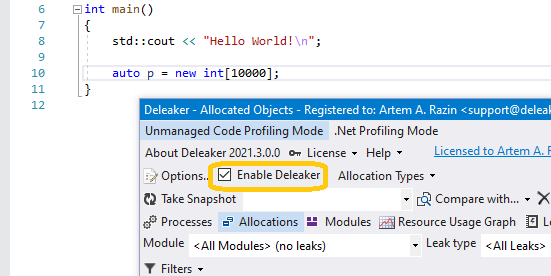
Click to Extensions – Deleaker – Deleaker Window. The memory profiler window appears. Ensure that it is enabled:
Deleaker works together with Visual Studio’s debugger, so just start debugging. You can set breakpoints, watch variables and do usual things, but now additionally, you can use the analyzer to take memory snapshots. A developer can take a snapshot at any moment (e.g., when the debugger has stopped at a breakpoint): just click on Take Snapshot. Also, the analyzer takes a final snapshot after the process quits. Such a snapshot contains essential information about those allocations that haven’t been freed by the program (usually, such allocations are called leaks.
Start debugging and let the application exit. The memory analyzer immediately starts taking a snapshot and displays it once the snapshot is ready:
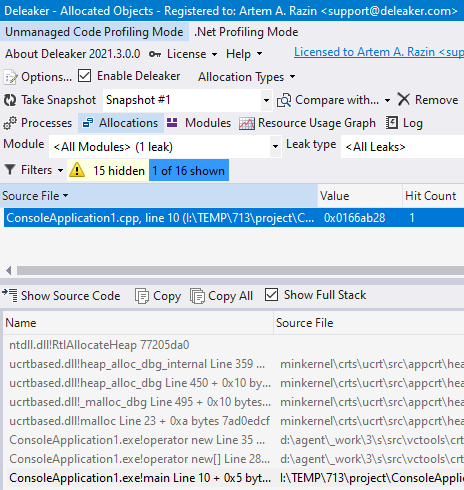
Well, the analyzer displays correct information: a single leak, the line number, the source file name. Double-click the allocation entry to navigate the source code.
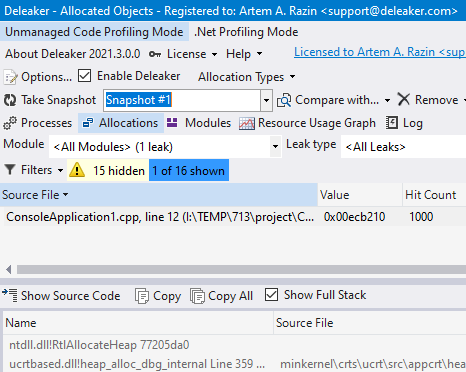
You may notice the column Hit Count. This column shows the total count of allocations that happened at the same place. Sorting by Hit Count helps identify permanent leakage. Let’s illustrate it. Instead of single allocation, we add a loop that allocates memory 1000 times:
for (auto i = 0; i < 1000; i++)
{
    auto p = new int[10000];
}
Rebuild the project and run it again. In the final snapshot, we see Hit Count = 1000:
Conclusion
Memory usage analysis helps find leaks in both managed and unmanaged code. A memory analyzer can take memory snapshots. Snapshots contain complete information about allocated memory, including allocations size, hit count, and call stack.
There is a memory analyzer that can be added to Visual Studio, called Deleaker. It is tightly integrated with the IDE, and also can work as a standalone tool. The analyzer allows to view memory usage of a process without leaving Visual Studio.