Managed memory leaks in C#
Contents
- Managed Memory Leak – the definition
- The Garbage Collector
- Event handlers – what to remember
- Event handlers – get the things right
- Managed Memory Leaks – How to detect them
- Another tricky case – Timers
- Yet another tricky case – WPF desktop applications
- GC and finalization
- GC and Large Object Heap
- Conclusion
Managed Memory Leak – the definition
As a programmer you are probably in the know that every program needs a certain amount of memory to place the data which it operates on. The large amount of memory used doesn’t yet indicate memory leak problems and may be a result of a non-optimal model or an incorrectly chosen algorithm. Even when the program constantly allocates more memory and doesn’t release it or doesn’t return it back, we can still have a deal with a kind of logical bug or a lack of optimization, meaning that every piece of allocated memory is used in some way and still can be released.
A memory leak is a state of the program when a part of the allocated memory is not used in any way and cannot be deallocated. In unmanaged languages like C++ we have to manually deallocate memory as it is no longer needed. If we have forgotten to do that, the memory becomes unreachable, so a memory leak results. In a managed environment we can neither deallocate memory occupied by the object manually in predictable manner nor specify the order of reclaims. CLR’s garbage collector does that for us; all we can do is to force garbage collection as a whole process. If everything happens automatically without our intervention, then one could ask, where memory leaks come from? As we have mentioned before, the leak occurs when some objects are no longer reachable from our code, but GC treats them as reachable, because the program still references them indirectly.
The Garbage Collector
Recall how the GC decides, which objects are eligible for garbage collection, and which are not. It builds so-called reachability graph, beginning from the roots. A root is one of the following:
- a local variable or parameter of any method in call stack;
- a static variable;
- an object in the finalization queue.
The other objects, referenced directly or indirectly from one of the root objects, are considered reachable. Thus, the rest of the objects are considered unreachable and they are subject to collection. We will be interested in GC – reachable objects which are no longer referenced from our code. Next, we will consider typical cases that lead to such situations, how to avoid them, and methods and tools for analyzing managed memory.
Event handlers – what to remember
Event handlers are the most common case for unused or forgotten references. Consider the following code:
class Sender
{
    public event EventHandler<EventArgs>? SomeEvent;
}

class Receiver
{
    public void OnSomeEvent(object? sender, EventArgs e)
    {
    }
}

class Test
{
    private static readonly Sender _sender = new Sender();

    public static void Run()
    {
        for (int i = 0; i < 10_000; i++)
        {
            var receiver = new Receiver();
            _sender.SomeEvent += receiver.OnSomeEvent;
        }
    }
}
After the Run method exits, all Receiver objects are no longer available, but they are referenced indirectly via SomeEvent event and therefore are not subject to garbage collection. The lifetime of static _sender field and all Receiver instances respectively last until the end of application. If such a method is called repeatedly during operation and the objects are of a significant size, then memory leaks can be quite serious and can adversely affect the performance of the application and even the whole system.
Event handlers – get the things right
To avoid such situations, it is recommended to unsubscribe from an event, especially if the event source is a long-lived or global object. Alternatively, one can make use of WeakReference type if the subscription is loose and event handling can be skipped if the event receiver has been already collected. Below is an example of event implementation using weak references.
class WeakDelegate<T> where T: Delegate
{
    class InvokeInfo
    {
        public InvokeInfo(Delegate d)
        {
            Method = d.Method;
            if (d.Target != null)
            {
                WeakTarget = new WeakReference(d.Target);
            }
        }
        public MethodInfo Method { get; }
        public WeakReference? WeakTarget { get; }
    }

    private readonly List<InvokeInfo> _invokeInfos = new List<InvokeInfo>();
    public T? Handler
    {
        get
        {
            Delegate? result = null;

            foreach (var info in _invokeInfos.ToArray())
            {
                WeakReference? wr = info.WeakTarget;

                if (wr == null || wr.Target != null)
                {
                    Delegate handler = Delegate
.CreateDelegate(typeof(T), wr?.Target, info.Method);
                    result = Delegate.Combine(result, handler);
                }
                else
                {
                    _invokeInfos.Remove(info);
                }
            }

            return (T?)result;
        }
        set
        {
            _invokeInfos.Clear();
            Add(value);
        }
    }

    public void Add(T? handler)
    {
        if (handler != null)
        {
            _invokeInfos.AddRange(
                Array.ConvertAll(handler.GetInvocationList(), x => new InvokeInfo(x)));
        }
    }

    public void Remove(T? handler)
    {
        if (handler != null)
        {
            InvokeInfo? info = _invokeInfos.Find(x =>
                Equals(x.Method.MethodHandle, handler.Method.MethodHandle) &&
                Equals(x.WeakTarget?.Target, handler.Target));

            if (info != null)
            {
                _invokeInfos.Remove(info);
            }
        }
    }
}
Then the implementation of the event source might look like:
class Source
{
    public static readonly Source Instance = new Source();

    private readonly WeakDelegate<EventHandler<EventArgs>> _somethingHappened =
        new WeakDelegate<EventHandler<EventArgs>>();

    public event EventHandler<EventArgs>? SomethingHappened
    {
        add { _somethingHappened.Add(value);  }
        remove { _somethingHappened.Remove(value); }
    }

    public void FireSomethingHappened()
    {
        _somethingHappened.Handler?.Invoke(this, EventArgs.Empty);
    }
}
The idea is that the event receiver’s reference in the delegate (Delegate.Target) is changed to a weak reference, with the result that the receiver can be garbage collected. (In the case of event handling by a static method, a weak reference is not used).
Managed Memory Leaks – How to detect them
However, let’s return to analyzing and finding unnecessary objects in the application’s memory. As you might guess, there are many tools to solve this problem, but we will consider those that are always at hand, free of charge and often not inferior in efficiency to commercial products. In this article, we will use the Performance Profiler included with Visual Studio and the WinDbg utility (Debugging Tools for Windows) included with the Windows SDK.
Using Visual Studio Performance Profiler
Let’s run the following snippet under Performance Profiler in Visual Studio. Make sure that the “Memory Usage” tool is checked.
Console.WriteLine($"TotalMemory before: {GC.GetTotalMemory(false)}");
Console.WriteLine("Make the first memory snapshot and press Enter to continue");
Console.ReadLine();

Test.Run();

Console.WriteLine($"TotalMemory after: {GC.GetTotalMemory(true)}");
Console.WriteLine("Make the second memory snapshot and press Enter to exit");
Console.ReadLine();
After taking two memory snapshots, we will see the following picture:
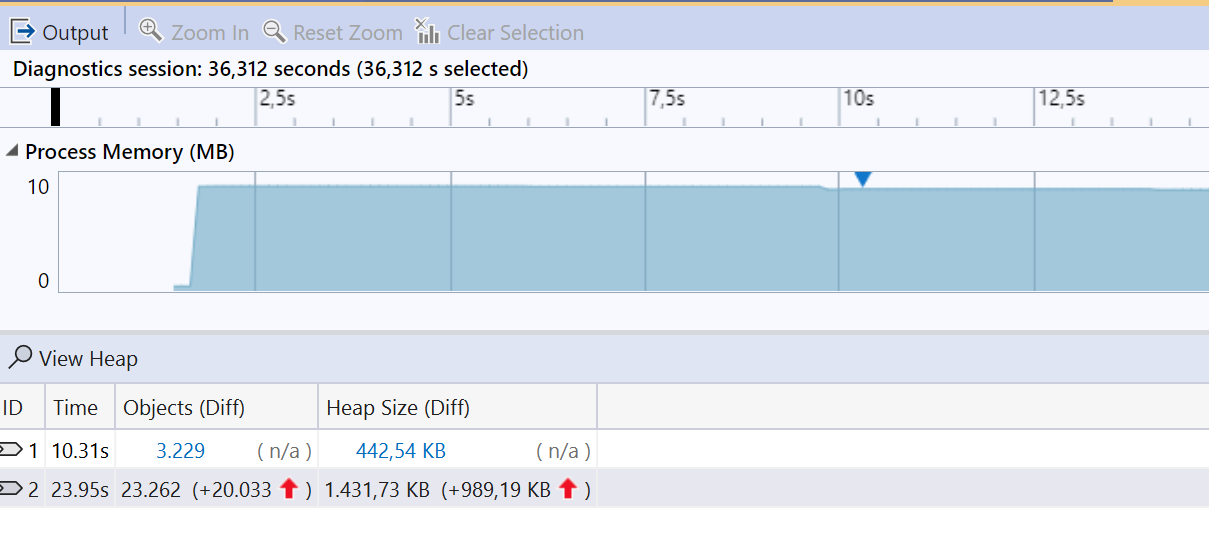
The memory usage has increased, and we can see allocated objects in a heap using a “View Heap” option:
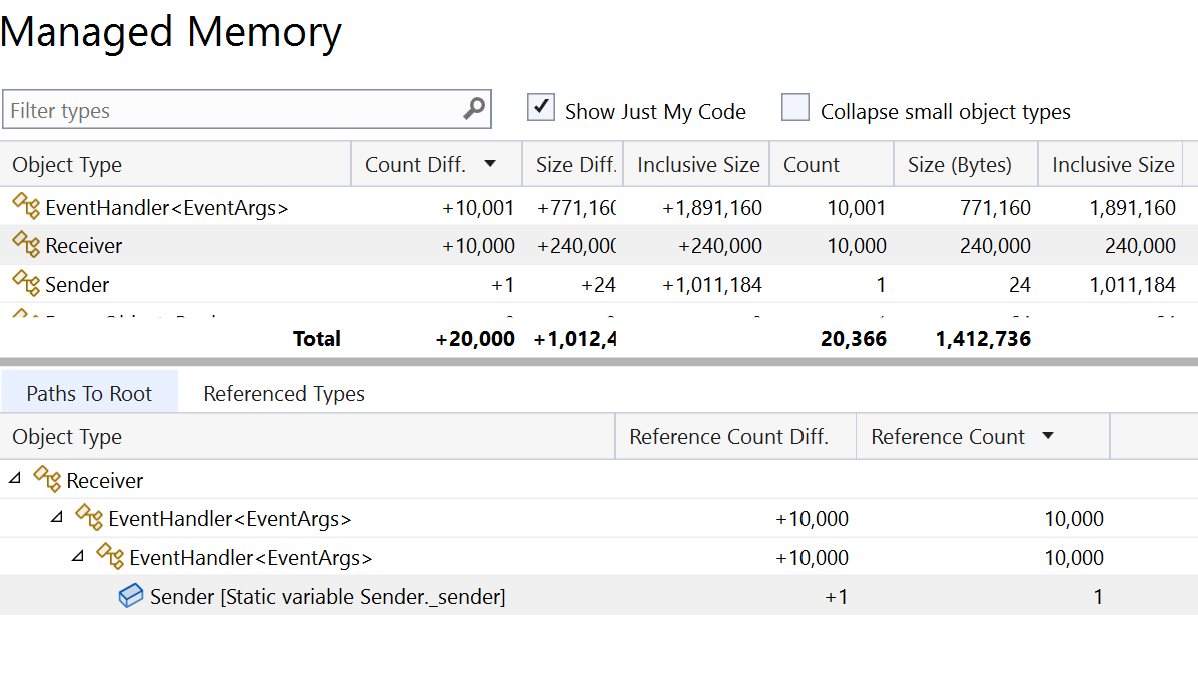
As you may see, we have a great number of Receiver objects, which are referenced from the static root _sender via instance of EventHandler delegate, which in turn is held in the delegate chain backing the SomethingHappened event in Sender. A nice feature of this report is the ability to “Go to Definition” or “Find all References” using the context menu on every object in the path, so we can directly find a place in code and fix it accordingly.
Using WinDbg
Now we will do the same analysis using WinDbg. We assume you have Windows SDK with Debugging Tools for Windows already installed. So let’s start the same snippet to the second prompt, start WinDbg and attach it to application process:
File -> Attach to a Process.
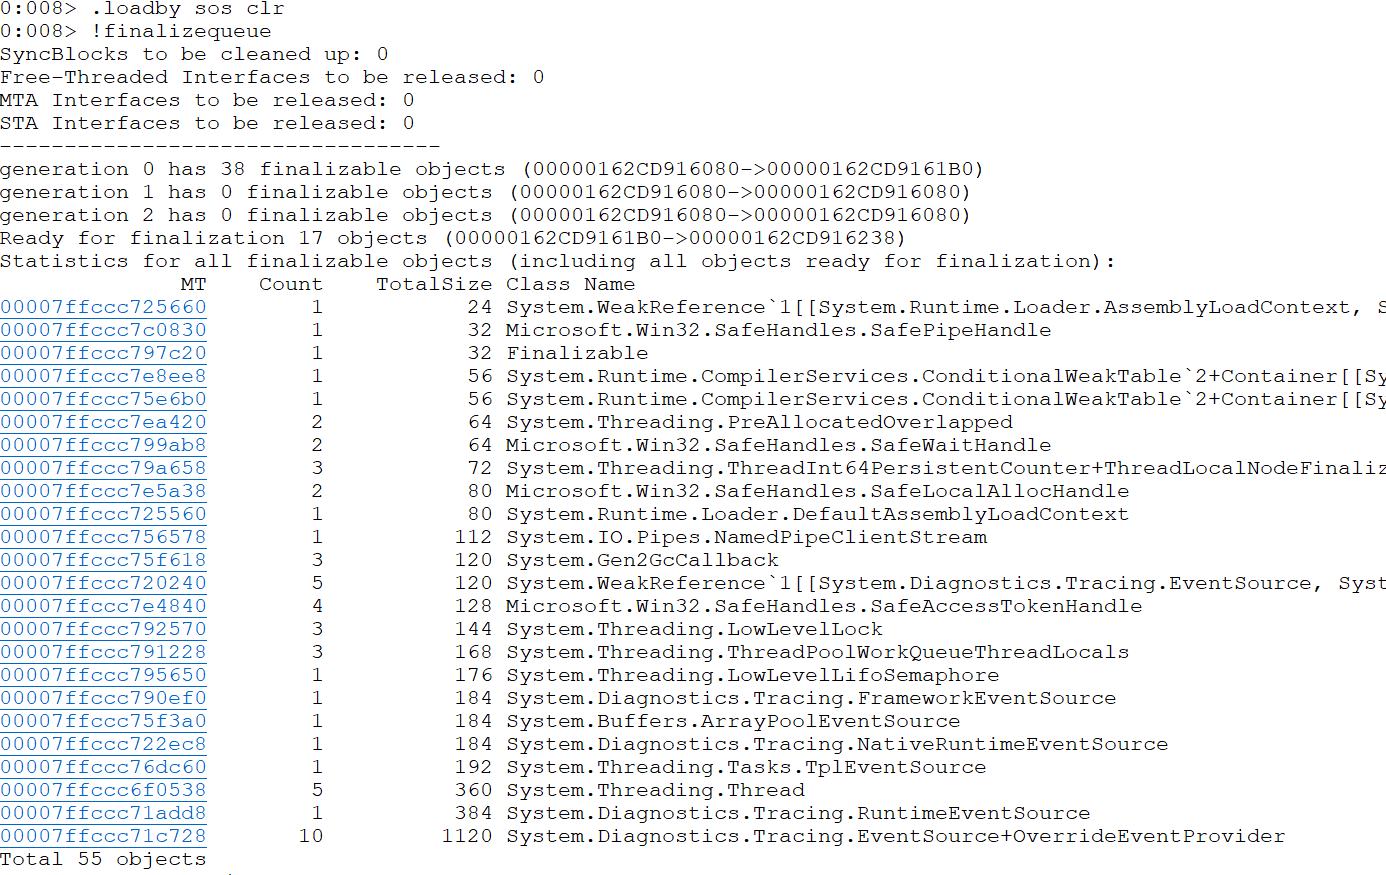
To get detailed information about the state of managed memory, we need the SOS Debugging Extension. To load it use:
.loadby sos clr (for .net 4.0 or later)
.loadby sos mscorwks (for .net 3.5 or earlier)
Once the sos extension is loaded we can inspect the managed heap, where the instances of reference types reside.
!dumpheap -stat
We will get a quite long list of all objects in the heap. Below is the output for our example with irrelevant data skipped:
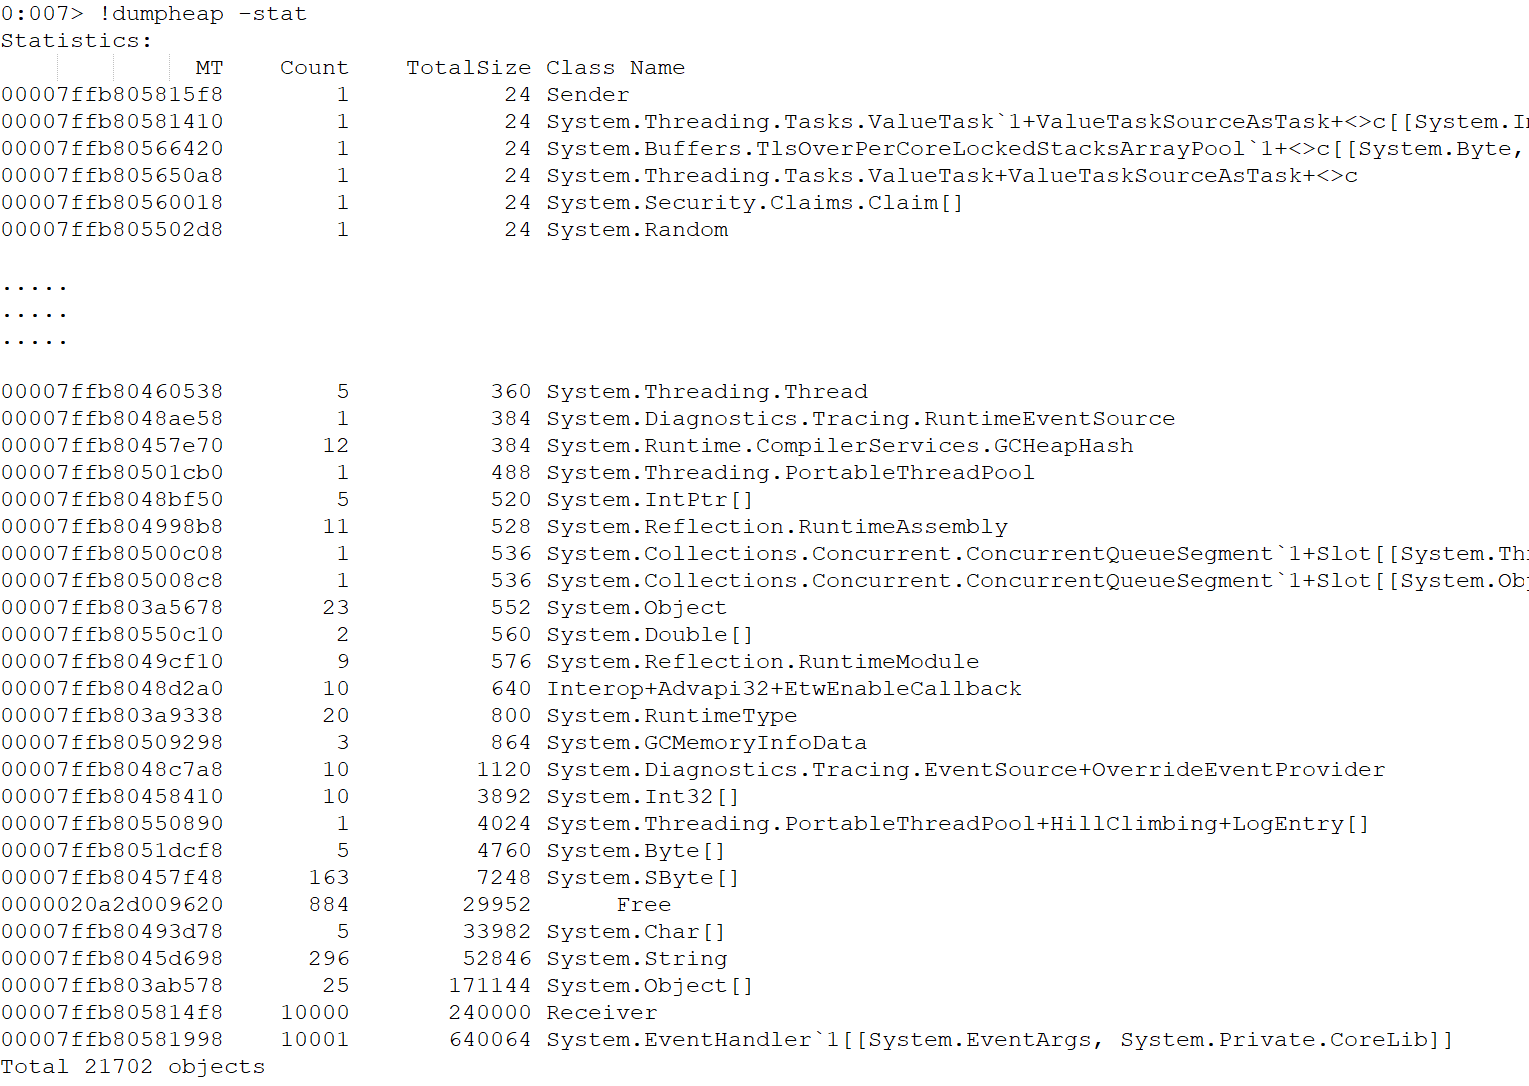
We are primarily interested in objects with large TotalSize values and we need to find out why they were not garbage collected. To find it out, we need to find the location of one of them in memory and traverse the path to it from the root object. Let’s filter the heap statistics by object type, using !dumpheap -type Receiver:
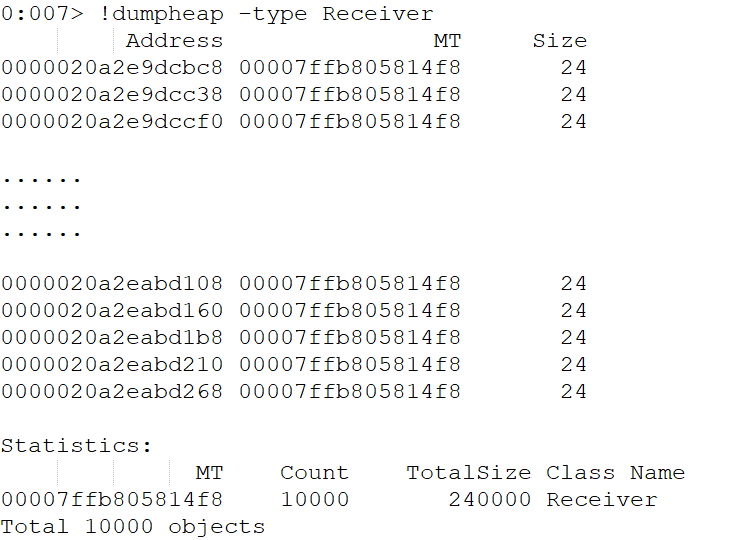
We then take the address of one of the objects to find the root object that refers to it:
!gcroot 0000020a2eabd268
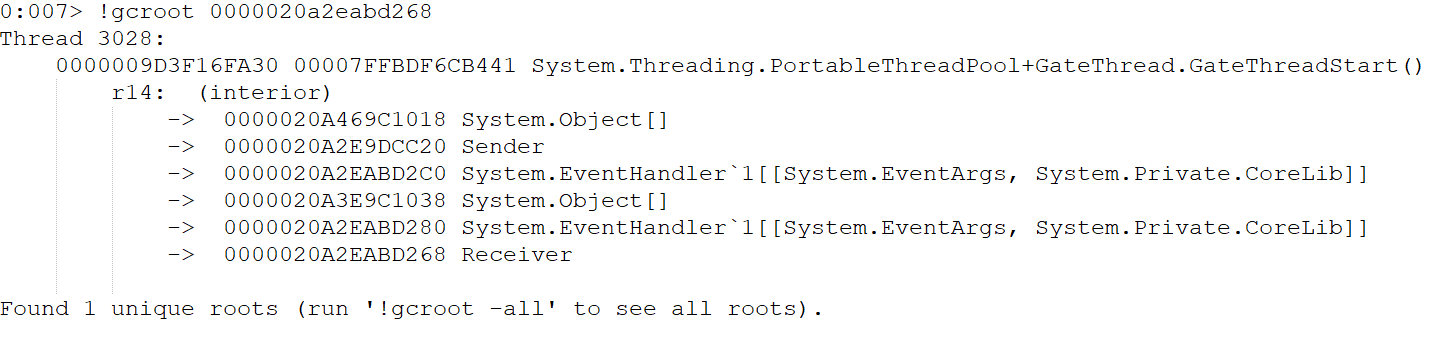
Another tricky case – Timers
Another cause of memory leaks can be timers, namely the Timer class from the System.Timers namespace. In the following example, an instance of a class that uses a timer once instantiatewill never be garbage collected:
class Timed
{
    private readonly System.Timers.Timer _timer;

    public Timed(int interval)
    {
        _timer = new System.Timers.Timer(interval);
        _timer.Elapsed += _timer_Elapsed;
        _timer.Start();
    }
    private void _timer_Elapsed(object? sender, System.Timers.ElapsedEventArgs e)
    {

    }
}
This occurs due to the fact that CLR itself will keep the _timer alive, until it is not disposed. The timer in turn will keep the Timed instance alive via subscription on Timer.Elapsed event. In this regard, it is useful to recall the rule that if a class has fields of IDisposable type (like Timer for example), then it must implement IDisposable itself. So out Timed class could look like this:
class Timed : IDisposable
{
    private readonly System.Timers.Timer _timer;

    public Timed(int interval)
    {
        _timer = new System.Timers.Timer(interval);
        _timer.Elapsed += _timer_Elapsed;
        _timer.Start();
    }

    public void Dispose()
    {
        _timer.Dispose();
    }

    private void _timer_Elapsed(object? sender, System.Timers.ElapsedEventArgs e)
    {

    }
}
Yet another tricky case – WPF desktop applications
A separate section should be devoted to memory leaks in WPF (Windows Presentation Foundation) applications. WPF makes heavy use of the MVVM (Model – View – View Model) pattern, which in turn uses Bindings, links between control properties and view model class properties. The simplest example might look like this.
The view model:
class PersonViewModel
{
    public string Name { get; set; }
}
The view (some declaration omitted for brevity):
<UserControl x:Class="WpfApp.PersonView">
    <Grid>
        <TextBox Text="{Binding Name}" />
    </Grid>
</UserControl>
When the view binds to a view model’s Name property, the binding target (TextBox) needs to know if the source property was changed, so the WPF checks if “Name” is a DependencyProperty or owning ViewModel implements INotifyPropertyChanged interface. If both checks fail WPF will instantiate a System.ComponentModel.PropertyDescriptor object and subscribe to its ValueChanged event to get notified when the source property value changes. The runtime keeps a reference to the created property descriptor (which refers respectively to the view model) until the end of the application, even when the view has already been disposed. The problem can be solved in two ways.
The first one is to implement INotifyPropertyChanged in view model:
class PersonViewModel : INotifyPropertyChanged
{
    private string _name;
    public string Name
    {
        get {  return _name; }
        set
        {
            if (_name != value)
            {
                _name = value;
                PropertyChanged?.Invoke(this, new PropertyChangedEventArgs("Name"));
            }
        }
    }

    public event PropertyChangedEventHandler PropertyChanged;
}
The second – to remove Binding explicitly:
BindingOperations.ClearBinding(textBox, TextBox.TextProperty);
Note that the issue doesn’t arise if the Binding has OneTime mode. There is simply no need to track the property changes in such a case.
Another memory leak example in WPF is x:Name leak. The specified on the element x:Name directive becomes the name of a field that is created in the underlying code when XAML is processed by a markup compilation, and that field holds a reference to the object. There is nothing to make a deal with, if the structure of controls is static, but sometimes it’s needed to update it at runtime, for example add or remove controls dynamically. Suppose we have the following markup somewhere in out views:
<Grid x:Name="layout">
     <TextBox x:Name="txtName" Text="{Binding Name}" />
</Grid>
Then to remove the TextBox from the Grid we could write something like that:
public partial class SampleView : UserControl
{
//      . . .

      private void RemoveNameTextBox()
      {
          if (txtName != null)
          {
              layout.Children.Remove(txtName);
              txtName = null;
          }
      }
}
In fact the control will stay in memory because WPF creates a global reference to the UI element if it uses the x:Name directive. To fix the issue one need to remove this reference explicitly:
private void RemoveNameTextBox()
{
    if (txtName != null)
    {
         this.UnregisterName("txtName");
         layout.Children.Remove(txtName);
         txtName = null;
    }
}
GC and finalization
Let’s come back to GC and see how it does its job and reclaims unused objects. Sometimes we have no issues with “lost” references, but the unreachable objects stay longer than expected alive or don’t get collected at all. Recall that GC makes use of generations to optimize its work and CLR allocates large objects separately on so-called LOH or Large Objects Heap. There are three generations: Gen0, Gen1 and Gen2. At first the objects live in Gen0 and if not reclaimed upon the next garbage collection get promoted to Gen1 and to Gen2 upon subsequent collections. So, the Gen0 contains the most short-living objects, and they are the best candidates for removal, since the GC expects that the long-living objects will be used again and doesn’t check their reachability every time. However, if the Gen0 has been already processed and the application still needs memory, GC can move on Gen1 and Gen2. LOH contains objects of size more than 85K and is not subject to defragmentation to avoid the copying of large memory blocks.
Thus, to ensure maximum performance, it is necessary that temporary objects do not go into Gen1 and Gen2 and the large object heap is not highly fragmented, as this slows down the allocation of memory for new objects and increase the size of LOH, since it contains unused memory blocks. The reason for the “unnecessary” transition to Gen1 may be the presence of a finalizer. If the GC, when removing an object in Gen0, sees that the object must be finalized, it puts it in the finalization queue, thereby extending its lifetime and promoting it to Gen1. On the next garbage collection, all objects in the finalization queue will have their finalizers called, removed from the queue, and become unreachable again. But they are already in Gen1 and can survive several more garbage collections, because the GC may not trigger processing higher generations, if there is no memory pressure in the system.
The Finalizer itself is an ordinary method (an overridden version of Object.Finalize, in C# one makes use of destructor syntax ~), so it can contain an arbitrary code, which may block or throw exceptions. Let’s look at a small example of how to check the finalization queue using WinDbg:
var sync = new object();

lock (sync)
{
    foreach (var i in Enumerable.Range(0, 10))
    {
        var f = new Finalizable(i, sync);
    }

    GC.Collect();
    GC.WaitForPendingFinalizers();
    Console.WriteLine("Finalization is done. Press Enter to exit");
    Console.ReadLine();
}

class Finalizable
{
    private object _sync;
    public Finalizable(int id, object sync)
    {
        Id = id;
        _sync = sync;
    }
     ~Finalizable()
    {
        lock (_sync)
        {
            Console.WriteLine($"Finalizing of {Id}");
        }
    }
    public int Id { get; }
}
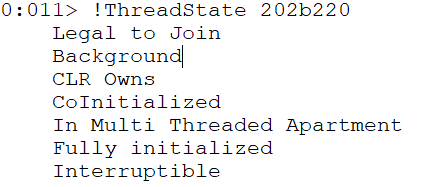
The code above instantiates ten Finalizable objects whose Finalize method should block while being called. That means that GC.WaitForPendingFinalizers should block as well, since the GC finalization thread stucks processing the first instance of Finalizable. Let’s start WinDbg attach to the application process, then load sos extension and use !finalizequeue command:
We see one Finalizable instance is ready for finalization. The !threads -special command provides us with threads statistics including Finalizer thread. Its running state indicates that the finalizer is blocked:
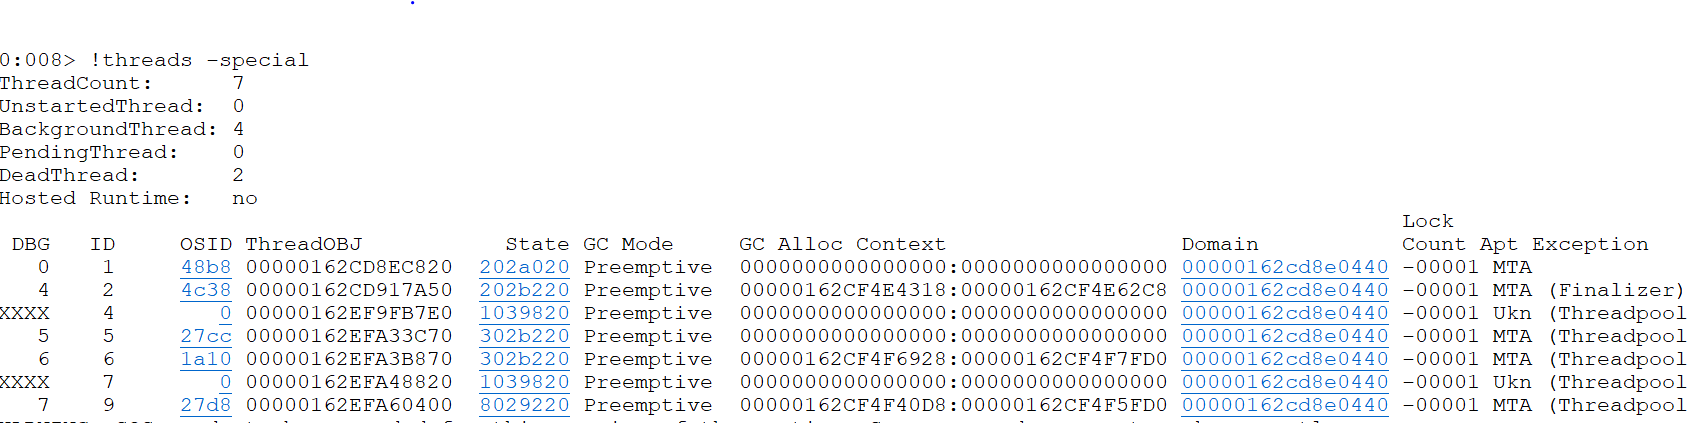
Based on the information above, one should always keep in mind the following rules, while overriding object’s Finalize:
- avoid overriding Finalize at all. Do it only if the class makes use of unmanaged resources and must free them upon disposal;
- if possible, consider inheriting from SafeHandle class, instead of implementing Finalize;
- always provide the possibility to dispose of resources explicitly using the Dispose pattern;
- don’t forget to call Dispose, if the type exposes it. (Due to historical reasons some types have a Close method, which normally does the same as Dispose). The using statement helps to call Dispose when the object goes out of scope, even if an exception is thrown.
GC and Large Object Heap
Let’s go back to fragmentation. Since the new object gets allocated in Gen0, during the garbage collection GC defragments or compacts the Gen0’s part of the managed heap, to speed up the allocations. But if an object were quite large, it could be difficult to move it onto a new place in a heap. MS took some testing and decided that the objects of size more than 85000 should be allocated separately on a special memory area called Large Object Heap (LOH), which will never be compacted (however since NET 4.5 one can adjust it). If the program makes heavy use of large objects creating and not keeping them alive, the LOH gets fragmented. This has two drawbacks – first, the LOH gets bigger, since it contains unused space, second – the allocations slow down, because one needs to find a suitable memory block, rather than simply appending to the end of allocated space if the heap would be compacted. As usual WinDbg provides us with a way to retrieve information about the LOH. Let’s start a small program and check the state of the managed heap:
long totalMillis = 0;
long maxMemory = 0;

for (int i = 0; i < 100; i++) {

    var stopwatch = new Stopwatch();
    stopwatch.Start();

    for (var k = 0; k < 1000; k++)
    {
        var random = new Random();
        var buffer = new Buffer(random.Next(85_000, 10_000_000));
    }

    //to force LOH compacting on .net 4.5 and later
    //GCSettings.LargeObjectHeapCompactionMode = GCLargeObjectHeapCompactionMode.CompactOnce;
    //GC.Collect(GC.MaxGeneration);

    stopwatch.Stop();
    totalMillis += stopwatch.ElapsedMilliseconds;

    var totalMemory = GC.GetTotalMemory(false);
    if (totalMemory > maxMemory)
    {
        maxMemory = totalMemory;
    }

    Console.WriteLine(
        $"Step: {i} Total memory {totalMemory}. Elapsed: {stopwatch.ElapsedMilliseconds}");
}

Console.WriteLine($"Elapsed: {totalMillis}. MaxMemory: {maxMemory}");
Console.WriteLine("Press enter to exit");
Console.ReadLine();

class Buffer
{
    private readonly byte[] _bytes;
    public Buffer(int size)
    {
        _bytes = new byte[size];
    }
}
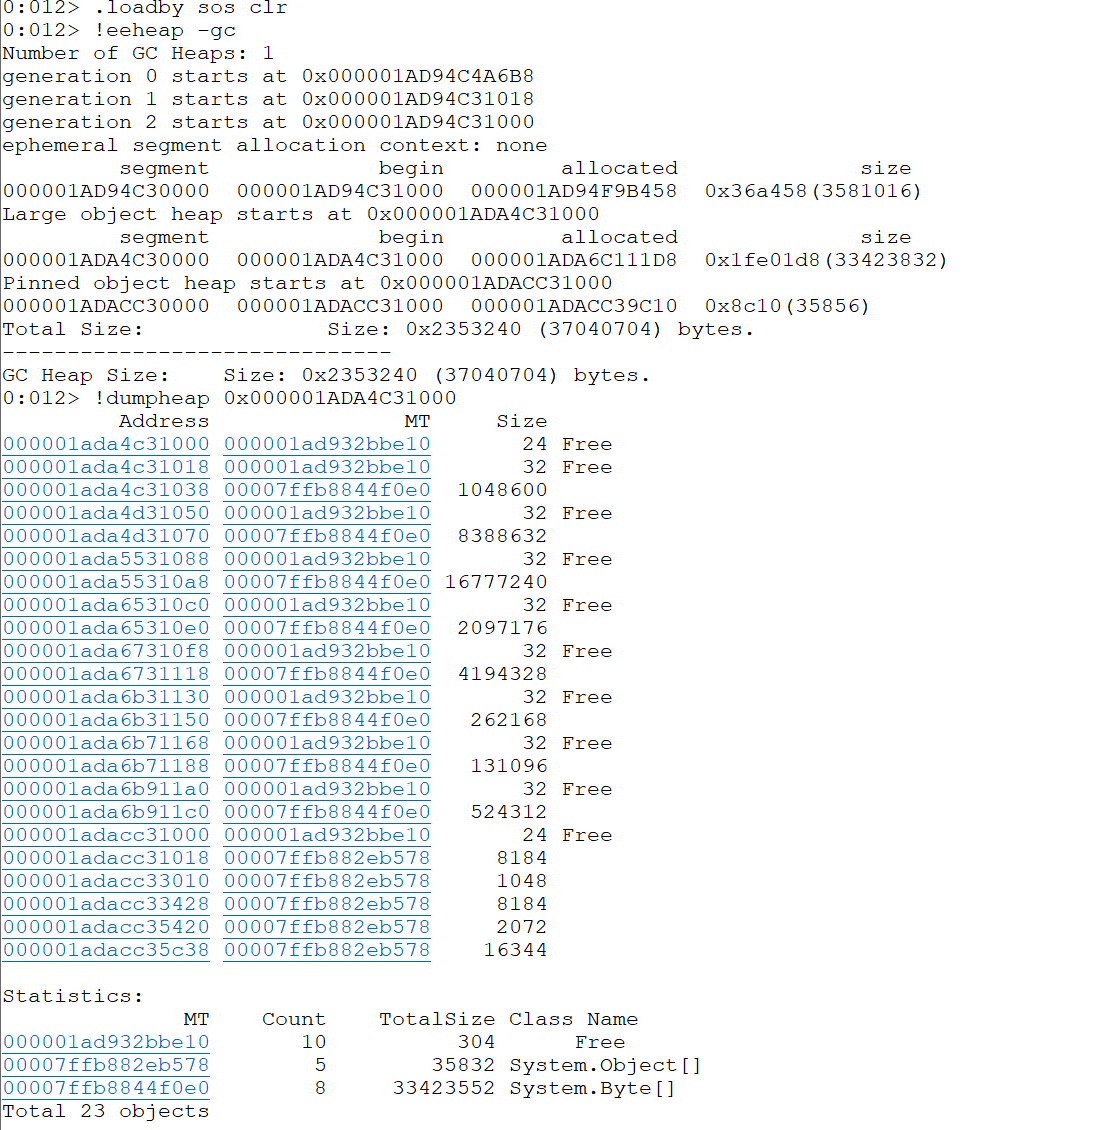
To inspect the heap, we use:
!eeheap -gc
!dumpheap <the_start_address_of_LOH>
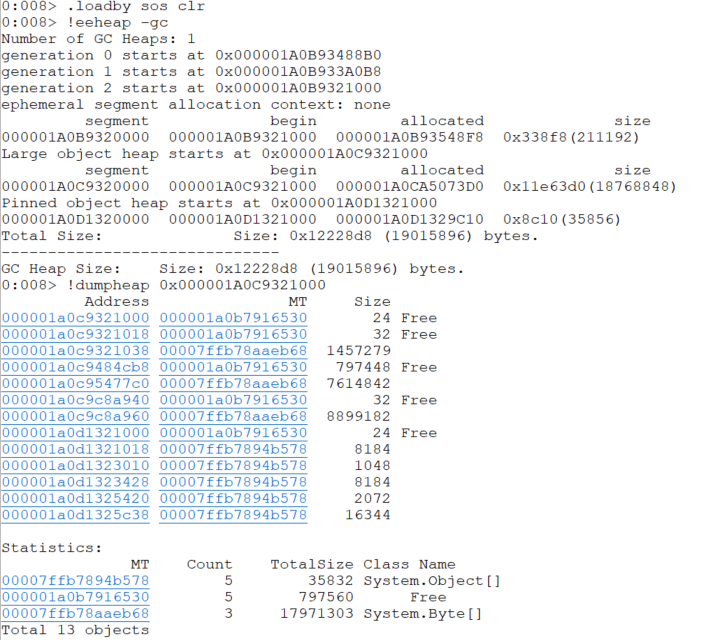
These statistics, of course, do not indicate problems, but allow us to estimate the total size, free space in the LOH, and give a baseline and ideas of further optimization, which could be important in high-load systems. To achieve optimal performance, the following recommendations can be made:
- use large objects sparingly;
- maximize their lifetime;
- reuse large objects.
In our last example, we could refactor the Buffer class as follows:
class Buffer : IDisposable
{
    private readonly byte[] _bytes;
    public Buffer(int size)
    {
        _bytes = ArrayPool<byte>.Shared.Rent(size);
    }
    public void Dispose()
    {
        ArrayPool<byte>.Shared.Return(_bytes);
    }
}
And use it:
for (var k = 0; k < 1000; k++)
{
     var random = new Random();
     using var buffer = new Buffer(random.Next(85_000, 10_000_000));
}
When using a pool, the memory consumption increases slightly, but this is offset by an increase in the speed of array allocations and the LOH space utilization.
Direct allocation:

Using array pool:

Conclusion
Of course, we did not list all cases of memory leaks, but showed the most common ones, and considered some of the available diagnostic methods. We hope this will help in practice to create reliable and productive applications.