In this article, we will demonstrate how to identify and resolve memory leaks in C and C++ when using GCC as your toolchain.
Contents
- Overview of Memory Leaks
- Existing Solutions for Memory Leak Detection
- Tool Installation and Usage Guide
- Conclusion
Overview of Memory Leaks
A memory leak refers to a situation in which computer programs unintentionally allocate memory but fail to release it when it is no longer needed. As a result, the memory remains allocated and unavailable for other processes or tasks, leading to a gradual accumulation of memory that is not being properly utilized. Over time, memory leaks can cause a significant degradation in system performance and may eventually lead to program crashes or system instability. It is important to identify and fix memory leaks to ensure efficient memory management and optimal performance of computer systems and applications.
In the context of C++, memory leaks occur when memory is allocated dynamically (using operators such as new or new[]) but not properly deallocated (using delete or delete[]). This can happen when objects or arrays are created dynamically but not released, leading to a memory leak.
C++ does not have built-in automatic garbage collection like some other programming languages. Therefore, it is the responsibility of the programmer to correctly allocate and deallocate memory. If memory allocation is not properly managed, especially within loops or long-running programs, it can result in memory leaks and inefficient memory usage.
To prevent memory leaks in C++, programmers should ensure that all dynamically allocated memory is released using the delete or delete[] operators when the memory is no longer needed. It is important to note that memory leaks can be challenging to debug and may require the use of specialized debugging tools or techniques to detect and fix them.
Let’s move on and see which solutions for memory leak detection support GCC.
Existing Solutions for Memory Leak Detection
GCC provides several facilities for memory leak detection. Some of these features include:
- AddressSanitizer (ASan): ASan is an instrumentation-based tool that detects memory errors such as buffer overflows, use-after-free, and memory leaks. It adds runtime checks to the code and reports any memory-related issues. By analyzing the state of the allocated memory at program exit, it can identify memory blocks that have not been freed, indicating potential leaks.
However, one drawback of ASan is that it lacks a user interface, making it difficult to understand what’s happening with memory while the application is running. - Valgrind: Although Valgrind is not part of GCC itself, it is a popular tool often used alongside GCC. Valgrind is a dynamic analysis tool that not only detects memory leaks but also detects other memory errors like the use of uninitialized memory and illegal memory access.
Similarly to ASan, Valgrind also lacks a user interface. Moreover, it virtualizes the code being executed, causing significant performance degradation. Additionally, Valgrind is a Linux-only tool and does not work on Windows. - GNU Libc Heap Checking: GCC also supports heap checking provided by GNU Libc. It includes functionality like tracking memory allocation and deallocation, detecting invalid frees, and reporting issues, including memory leaks.
- Similar to the previously mentioned tools, GNU Libc Heap Checking lacks a user interface and does not provide information about the memory state while the application is running.
While these tools and options can be utilized while compiling and running programs to detect memory leaks and diagnose various memory-related issues, a better approach is to use dedicated profilers aimed at fixing memory leak problems, such as Deleaker.
Deleaker does not instrument code, which makes this tool extremely fast. Instead, it utilizes hooks to efficiently gather information about allocated and freed memory. At any moment while your application is running, you can take a snapshot to view allocated memory blocks. For Windows, it also captures information about leaked handles, GDI objects, and other Windows-specific resources. Additionally, for each allocation, you can review its call stack to gain a better understanding of how to resolve this leak.
Let’s create a simple application with an intentional leak to see how Deleaker will catch it.
Tool Installation and Usage Guide
Create a new file called main.c and add the following code to it:
#include <stdlib.h>

int main(int argc, char argv)
{
    malloc(1);
}
This code obviously has a memory leak. Compile the file using gcc, and don’t forget to generate debug information using the -g option:
gcc.exe -g main.c -o main.exe
Now, it’s time to download and install Deleaker, a memory profiler for C and C++. You can download it from the following page:
https://www.deleaker.com/download.html
Since we won’t be working with any specific IDE, you can choose “Standalone Deleaker” during installation.
Run Deleaker, click on “Browse…” and select main.exe, then click on Start Debugging. Let the process exit and let Deleaker take a snapshot:
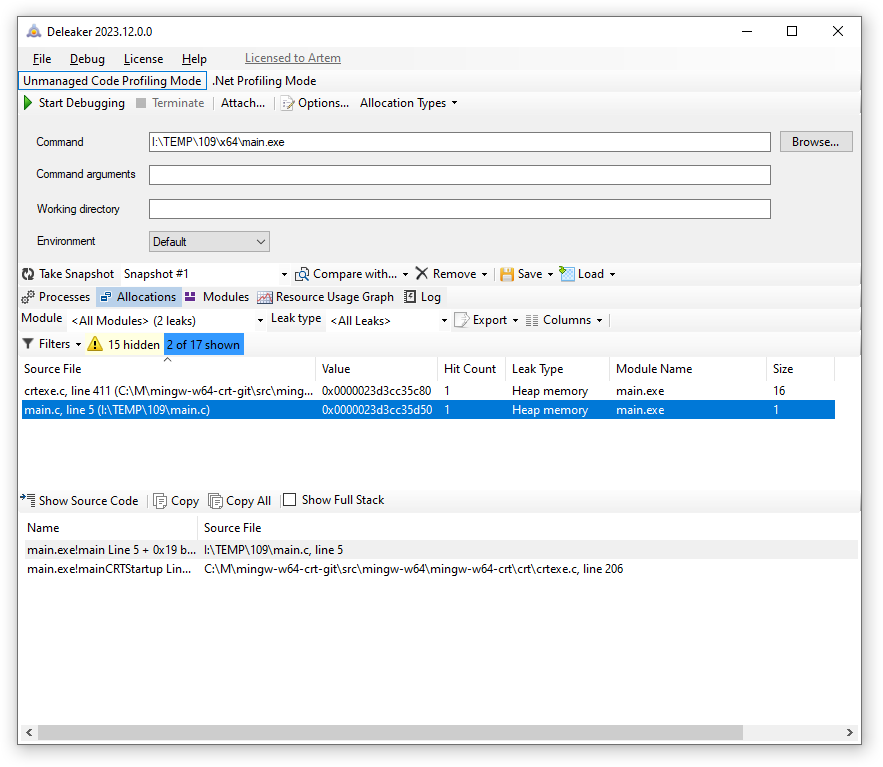
As you can see, Deleaker detects the memory leak. You can view the call stack and the size of the allocation.
What if we put memory allocation into a loop:
#include <stdlib.h>

int main(int argc, char argv)
{
    int i = 0;
    for (; i < 100; i++)
        malloc(1);
}
Profile it again in Deleaker:
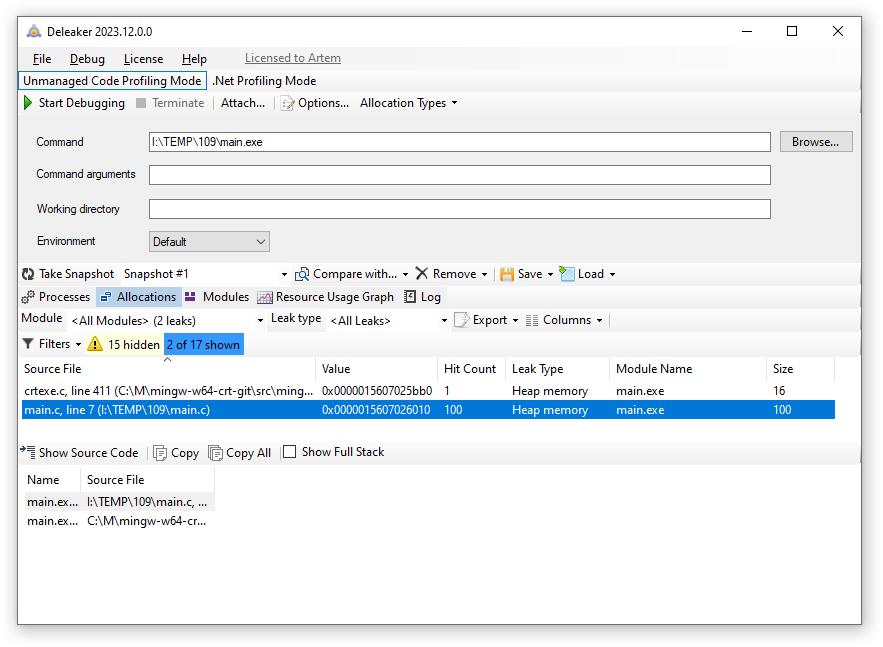
You will still see the same memory leak, but this time Deleaker grouped all the allocations into a single leak with a hit count of 100. The hit count indicates how many times the same call stack resulted in allocations. Sorting leaks by hit count is a good idea as the most serious leaks are those that occur repeatedly.
Conclusion
With the help of Deleaker, you can quickly identify memory leaks in your code. Deleaker offers integration with popular IDEs such as Visual Studio, RAD Studio, and Qt Creator. Additionally, Deleaker comes with a standalone tool.
Deleaker allows developers to create snapshots at any moment while the process is running. You can compare these snapshots to identify places in your code where permanent memory problems occur.
Deleaker supports a wide range of modern compilers, including GCC, which simplifies and streamlines the process of locating memory leaks, making it more efficient.
You can download Deleaker from the following page:
https://www.deleaker.com/download.html