Thanks to the Java Native Interface (JNI), Java applications can interact with native code. While memory allocations made by Java code are automatically managed by garbage collection, native code is responsible for its own memory management. This can lead to memory leaks if not handled properly. In this article, you will learn how to detect and fix these leaks with the help of memory profiling.
Contents
Create a Sample
Let’s start with a sample that consists of two parts: a Java application that calls native code located in a DLL, and the DLL itself. The application will call a native function, passing a string to it, and the DLL will output this string to the console.
Create a folder named JavaNativeLeaks to store the code for both parts of the sample. First, create a Java application called LeaksTestApp. The LeaksTestApp.java file will contain the entry point and will call the native function in a loop, as shown below:
public class LeaksTestApp {
    public static void main(String[] args) {
        while (true) {
            new NativeLeaksLibrary().WriteConsole("test");
        }
    }
}
NativeLeaksLibrary, in turn, is located in NativeLeaksLibrary.java:
public class NativeLeaksLibrary {
    static {
        System.loadLibrary("NativeLeaksLibrary");
    }

    public native void WriteConsole(String name);
}
Build and run the project. You should see the following exception:
Exception in thread "main" java.lang.UnsatisfiedLinkError: no NativeLeaksLibrary in java.library.path:
	at java.base/java.lang.ClassLoader.loadLibrary(ClassLoader.java:2439)
	at java.base/java.lang.Runtime.loadLibrary0(Runtime.java:916)
	at java.base/java.lang.System.loadLibrary(System.java:2068)
	at NativeLeaksLibrary.<clinit>(NativeLeaksLibrary.java:3)
	at LeaksTestApp.main(LeaksTestApp.java:4)
This occurred because the native library was not found. Now it’s time to create it. We will use CMake and Visual Studio 2022. First, create a directory named NativeLeaksLibrary within JavaNativeLeaks and include the following CMakeLists.txt file:
project ("NativeLeaksLibrary")

add_custom_command(
    OUTPUT NativeLeaksLibrary.h
    COMMAND javac -h . ..\\LeaksTestApp\\src\\NativeLeaksLibrary.java
    WORKING_DIRECTORY "${CMAKE_CURRENT_SOURCE_DIR}"
)

add_library (NativeLeaksLibrary SHARED "NativeLeaksLibrary.cpp" "NativeLeaksLibrary.h")

target_include_directories(NativeLeaksLibrary PRIVATE $ENV{JAVA_HOME}/include)
target_include_directories(NativeLeaksLibrary PRIVATE $ENV{JAVA_HOME}/include/win32)

if (CMAKE_VERSION VERSION_GREATER 3.12)
  set_property(TARGET NativeLeaksLibrary PROPERTY CXX_STANDARD 20)
endif()
As you can see, the project is very simple: NativeLeaksLibrary.h is generated by the tool javac -h from the Java class definition. NativeLeaksLibrary.cpp contains the implementation of the interface:
#include <iostream>
#include <windows.h>
#include "NativeLeaksLibrary.h"

JNIEXPORT void JNICALL Java_NativeLeaksLibrary_WriteConsole
(JNIEnv* env, jobject, jstring name)
{
    jboolean isCopy;
    auto const ptr = env->GetStringChars(name, &isCopy);

    std::wcout << (wchar_t*)ptr << std::endl;
}
Java_NativeLeaksLibrary_WriteConsole gets a raw pointer to a character array from the passed “jstring” in order to output it.
So far, so good. Build “NativeLeaksLibrary” and copy “NativeLeaksLibrary.dll” to the Java application’s production directory. Then start the application to ensure it’s working properly. Now, if you monitor the memory usage of the process in Task Manager while it is running, you will notice that the memory usage of the Java process keeps increasing:
It looks like there’s a memory leak! Let’s try to fix it using a memory profiler.
How to Use a Memory Profiler to Find Leaks?
Instead of desperately searching for the source of leaks in a large codebase, you should use a specialized tool for finding memory leaks: a memory profiler. For example, you can use Deleaker, which can find not only memory leaks but also GDI leaks, handle leaks, and much more. Download it from the following link: https://www.deleaker.com/download.html
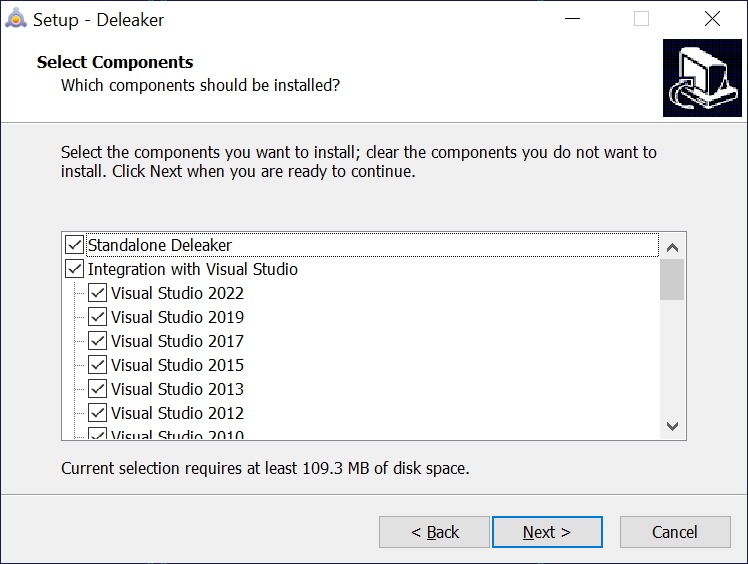
It’s important to select “Standalone Deleaker” during installation because we are going to use the standalone profiler to hunt leaks:
Once Deleaker is installed, run it, click “Attach…” and choose the leaking process. Then take a baseline snapshot and allow the process to consume more memory. After that, take a second snapshot, click “Compare With…” and select the baseline snapshot. This will help you see only the new allocations, which is useful if you are experiencing a persistent memory leak. It’s a good idea to disable all filters:

The following stack entry refers to NativeLeaksLibrary.cpp:
NativeLeaksLibrary.dll!Java_NativeLeaksLibrary_WriteConsole Line 9 + 0x12 bytes 00007fff83a02e58 E:\Projects\JavaNativeLeaks\NativeLeaksLibrary\NativeLeaksLibrary.cpp, line 9
Take another look at the code:
#include <iostream>
#include <windows.h>
#include "NativeLeaksLibrary.h"

JNIEXPORT void JNICALL Java_NativeLeaksLibrary_WriteConsole
(JNIEnv* env, jobject, jstring name)
{
    jboolean isCopy;
    auto const ptr = env->GetStringChars(name, &isCopy);

    std::wcout << (wchar_t*)ptr << std::endl;
}
From the GetStringChars documentation: Returns a pointer to the array of Unicode characters of the string. This pointer is valid until ReleaseStringChars() is called.
Aha, that’s it! We forgot to call ReleaseStringChars!
Wrap-up
Fixing native memory leaks in Java applications can be a challenge. Fortunately, with the help of memory profilers, you can efficiently obtain a list of allocated resources along with their call stacks. Saving and loading snapshots allows you to share them with others and analyze them later.