Introduction
This article will demonstrate how to find memory leaks in a windows service written in C++ or plain C.
Windows service is a special kind of application, that runs in the background and follows special rules and cooperates with the Service Component Manager. A windows service is controlled by the Service Component Manager: it starts, pauses, stops and resumes windows services.
Being a long-running process, a windows service might have leaks that are hard to find. It may be memory blocks that are periodically allocated, or handles that are opened on each request. Suddenly a windows service process closes, running out of memory, or exits unexpectedly because an operation of opening a file fails.
In general, a developer may run into obstacles while profiling windows services. Let’s look at how Deleaker can help you with such issues.
Deleaker is a memory profiler for C++ that works as a standalone application, or as a plugin for all popular IDEs, including Visual Studio. In case a developer can reproduce memory leakage in development environment, using Deleaker as a plugin is very reasonable, as Deleaker cooperates with Visual Studio, and one can easily navigate to the source code of a leak. But very often a windows service leaks in production only; in such case standalone version of Deleaker is to the rescue.
Building a windows service
For this tutorial, let’s create a simple windows service. Launch Visual Studio, select ATL Project, name the project as “SampleService”. Choose Service (.exe) as Application type at last step.
Visual Studio creates several files with basic code for the windows service. By default, it is supposed that some COM objects will be added, but the sample service is not the case. To prevent the service from immediate stopping, add the following line to pch.h:
#define _ATL_NO_COM_SUPPORT 1
Also there is a known bug that prevents the service from starting. Let’s apply suggested changes to workaround the bug:
HRESULT PreMessageLoop(int nShowCmd)
{
    SetServiceStatus(SERVICE_RUNNING);
    return __super::PreMessageLoop(nShowCmd);
}
But what useful will the service do? Well, the task is simple and useful: to ping some host and log information about its availability. The service will do the task in a separate thread, so let’s run the thread in Start() method. To ping let’s use the system utility ping.exe that is launching in infinite loop:
HRESULT Start(int nShowCmd) throw()
{
    _beginthreadex(nullptr, 0, &PingProc, this, 0, 0);

    return __super::Start(nShowCmd);
}

static unsigned __stdcall PingProc(void* param)
{
    auto thisPtr = (CSampleServiceModule*)param;

    while (true)
    {
        STARTUPINFOA* startupinfoPtr = new STARTUPINFOA;
        memset(startupinfoPtr, 0, sizeof(*startupinfoPtr));
        startupinfoPtr->cb = sizeof(*startupinfoPtr);

        PROCESS_INFORMATION pi;
        const BOOL res = CreateProcessA(
            nullptr,
            "ping.exe google.com",
            nullptr,
            nullptr,
            FALSE,
            0,
            nullptr,
            nullptr,
            startupinfoPtr,
            &pi);

        if (!res)
        {
            thisPtr->LogEvent(L"Failed to run ping.exe");
            return 0;
        }

        WaitForSingleObject(pi.hProcess, INFINITE);
        DWORD exitCode;
        GetExitCodeProcess(pi.hProcess, &exitCode);

        if (0 != exitCode)
            thisPtr->LogEvent(L"Failed to ping google.com");
        else
            thisPtr->LogEvent(L"google.com is reachable");
    }

    return 1;
}
At first glance, the code looks well: a process of ping.exe is started, then the code waits until the process exits, and finally some text is written to the log depending on the exit code.
Now we can build the project. Once it’s built, register the service from the command line (you need to launch cmd.exe as administrator), launching the service’s exe with switch /Service. Please notice that you should use the full path of the service exe:
“V:\Projects\Deleaker\SampleService\Debug\SampleService.exe” /Service
Find leaks of windows service in Visual Studio
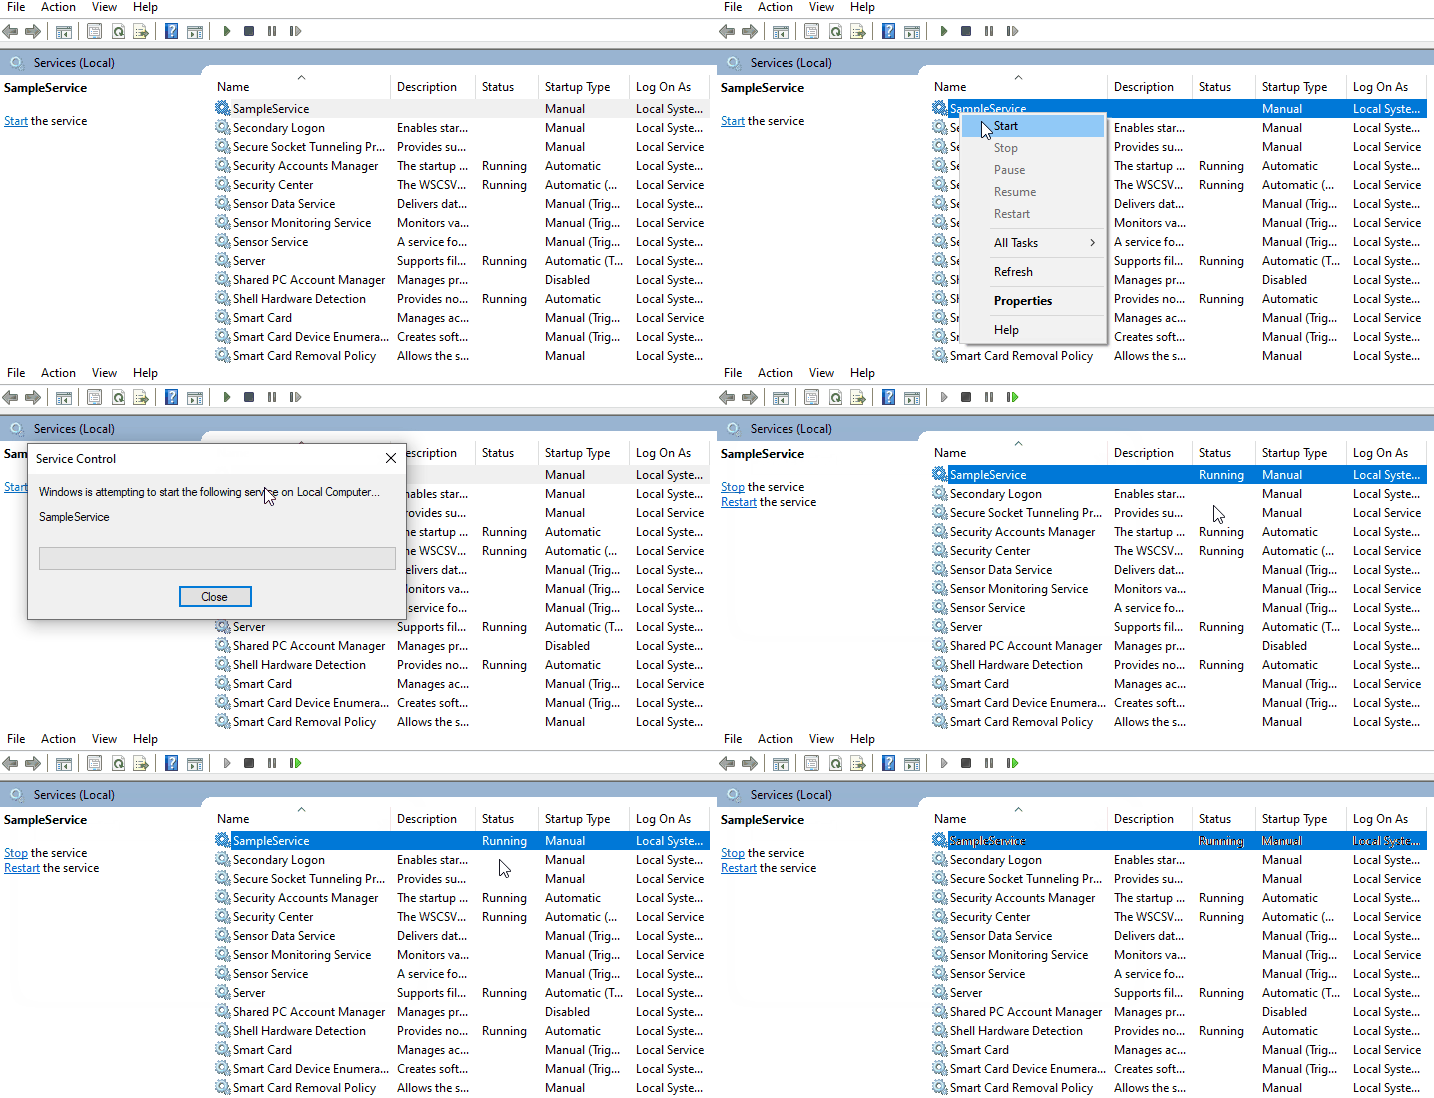
To start service let’s launch using services.msc. Find SampleService there, open context menu and select Start:
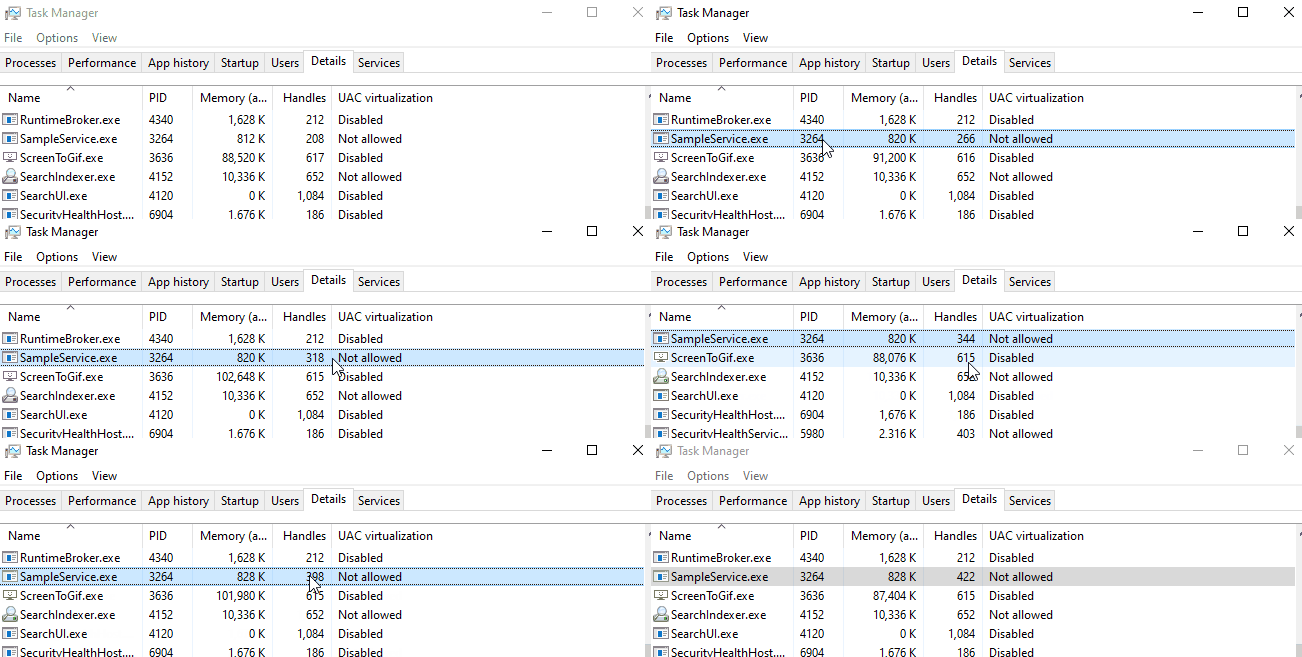
But suddenly one notices that the number of opened handlers and memory usage are increasing:
It’s time to fix the leakage.
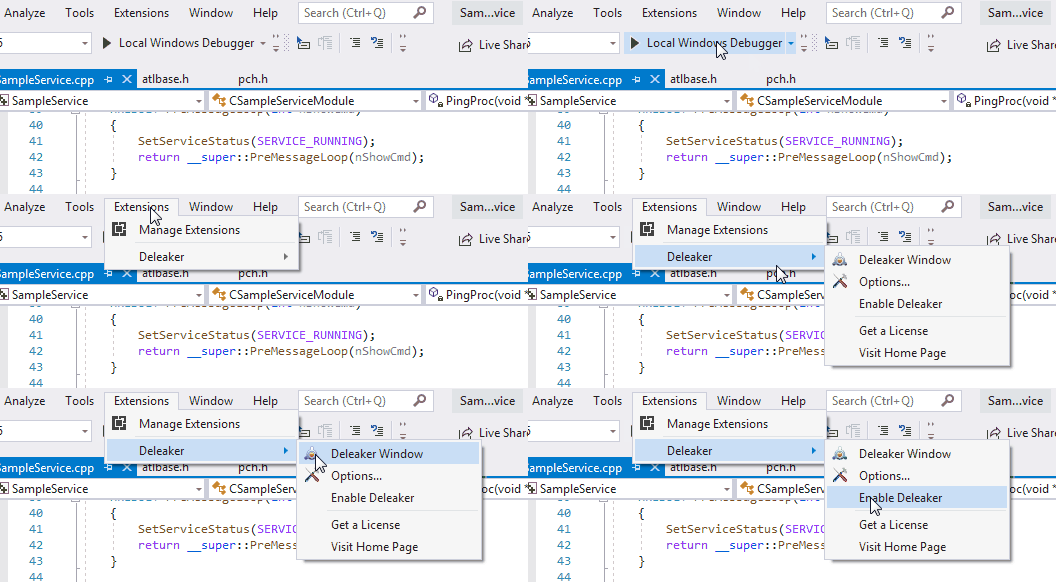
Start Visual Studio, ensure that Deleaker is enabled:
A windows service is started by the Service Component Manager, that is why a developer can’t just launch the service from Visual Studio as usual application. That’s why a developer has to attach to the process of the windows service. It might happen that Visual Studio will ask to run with elevated privileges if they are required for debugging. Restart Visual Studio in such case.
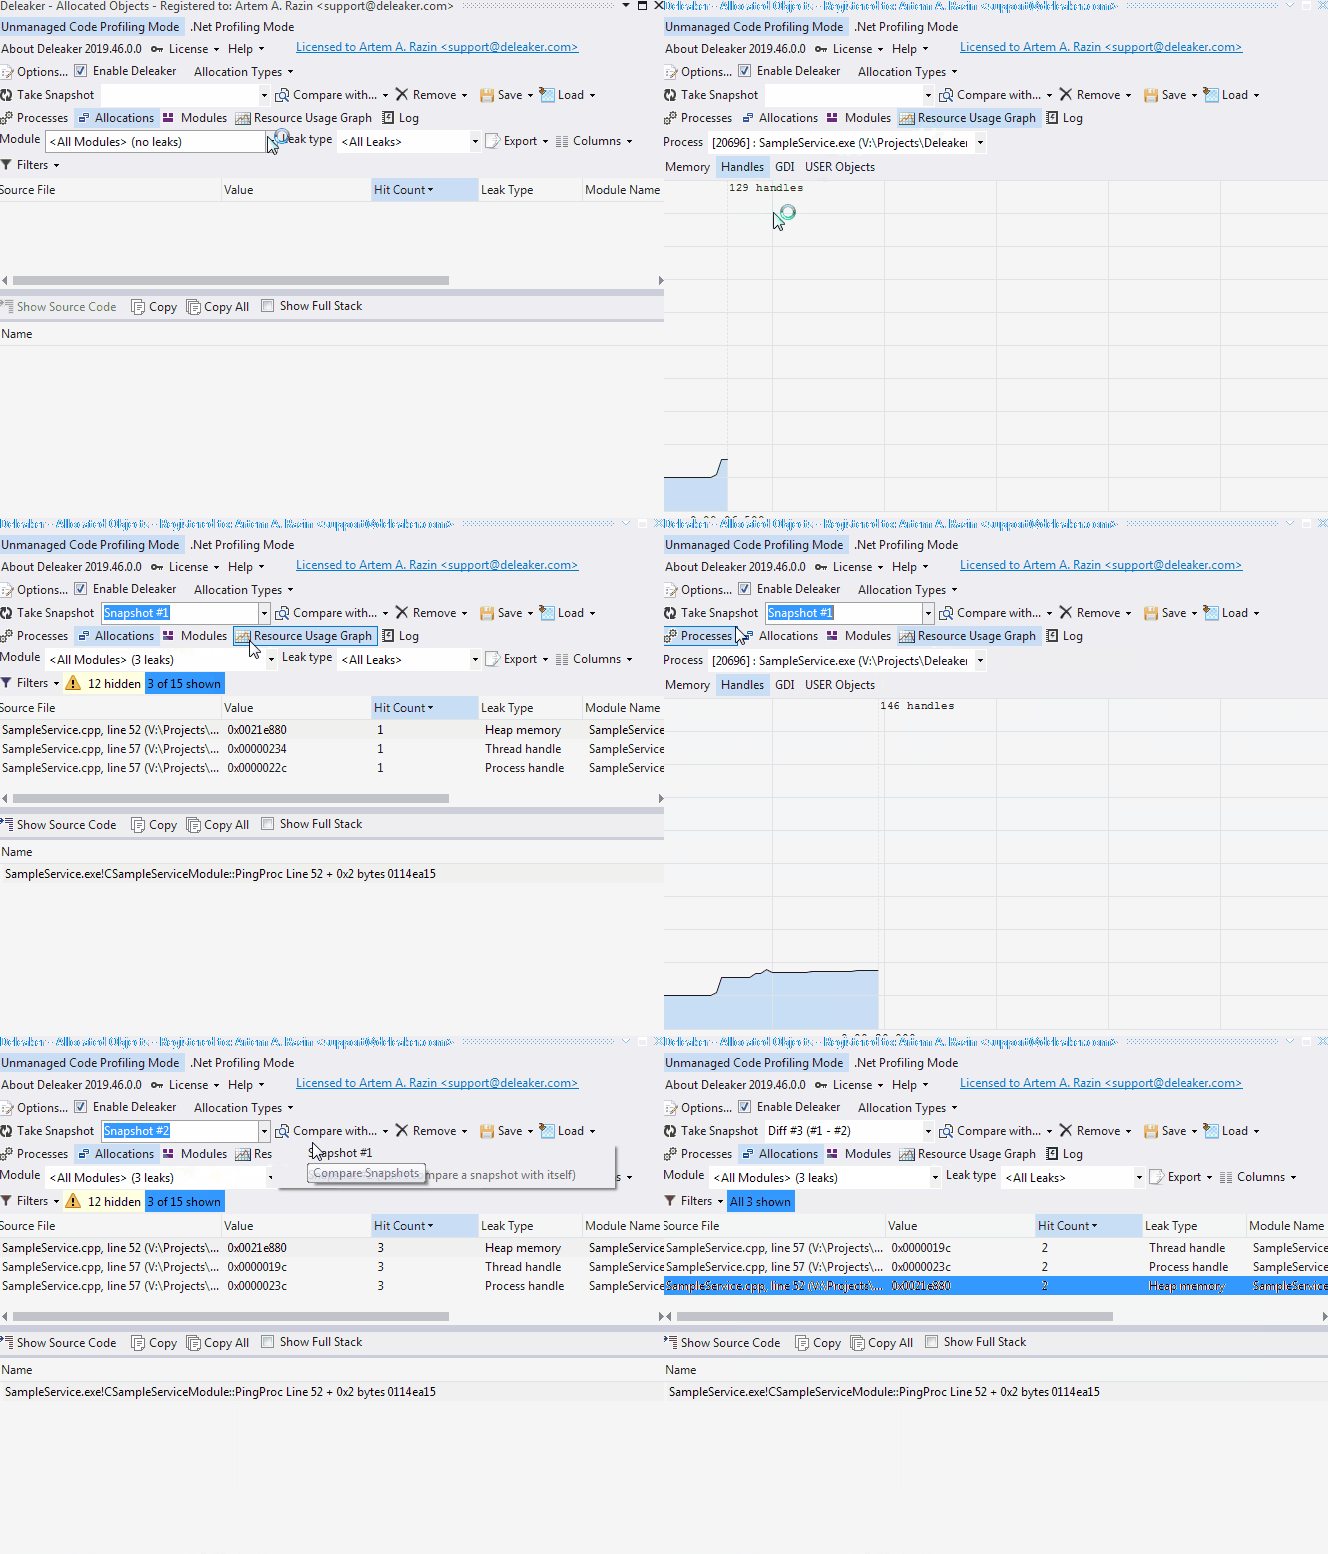
Also it’s a good idea to load the project of the service to help Deleaker prepare better report with knowledge what source files are from the project.
To attach to the service process, click to Debug – Attach to…, tick “Show processes from all users” and select SampleService.exe.
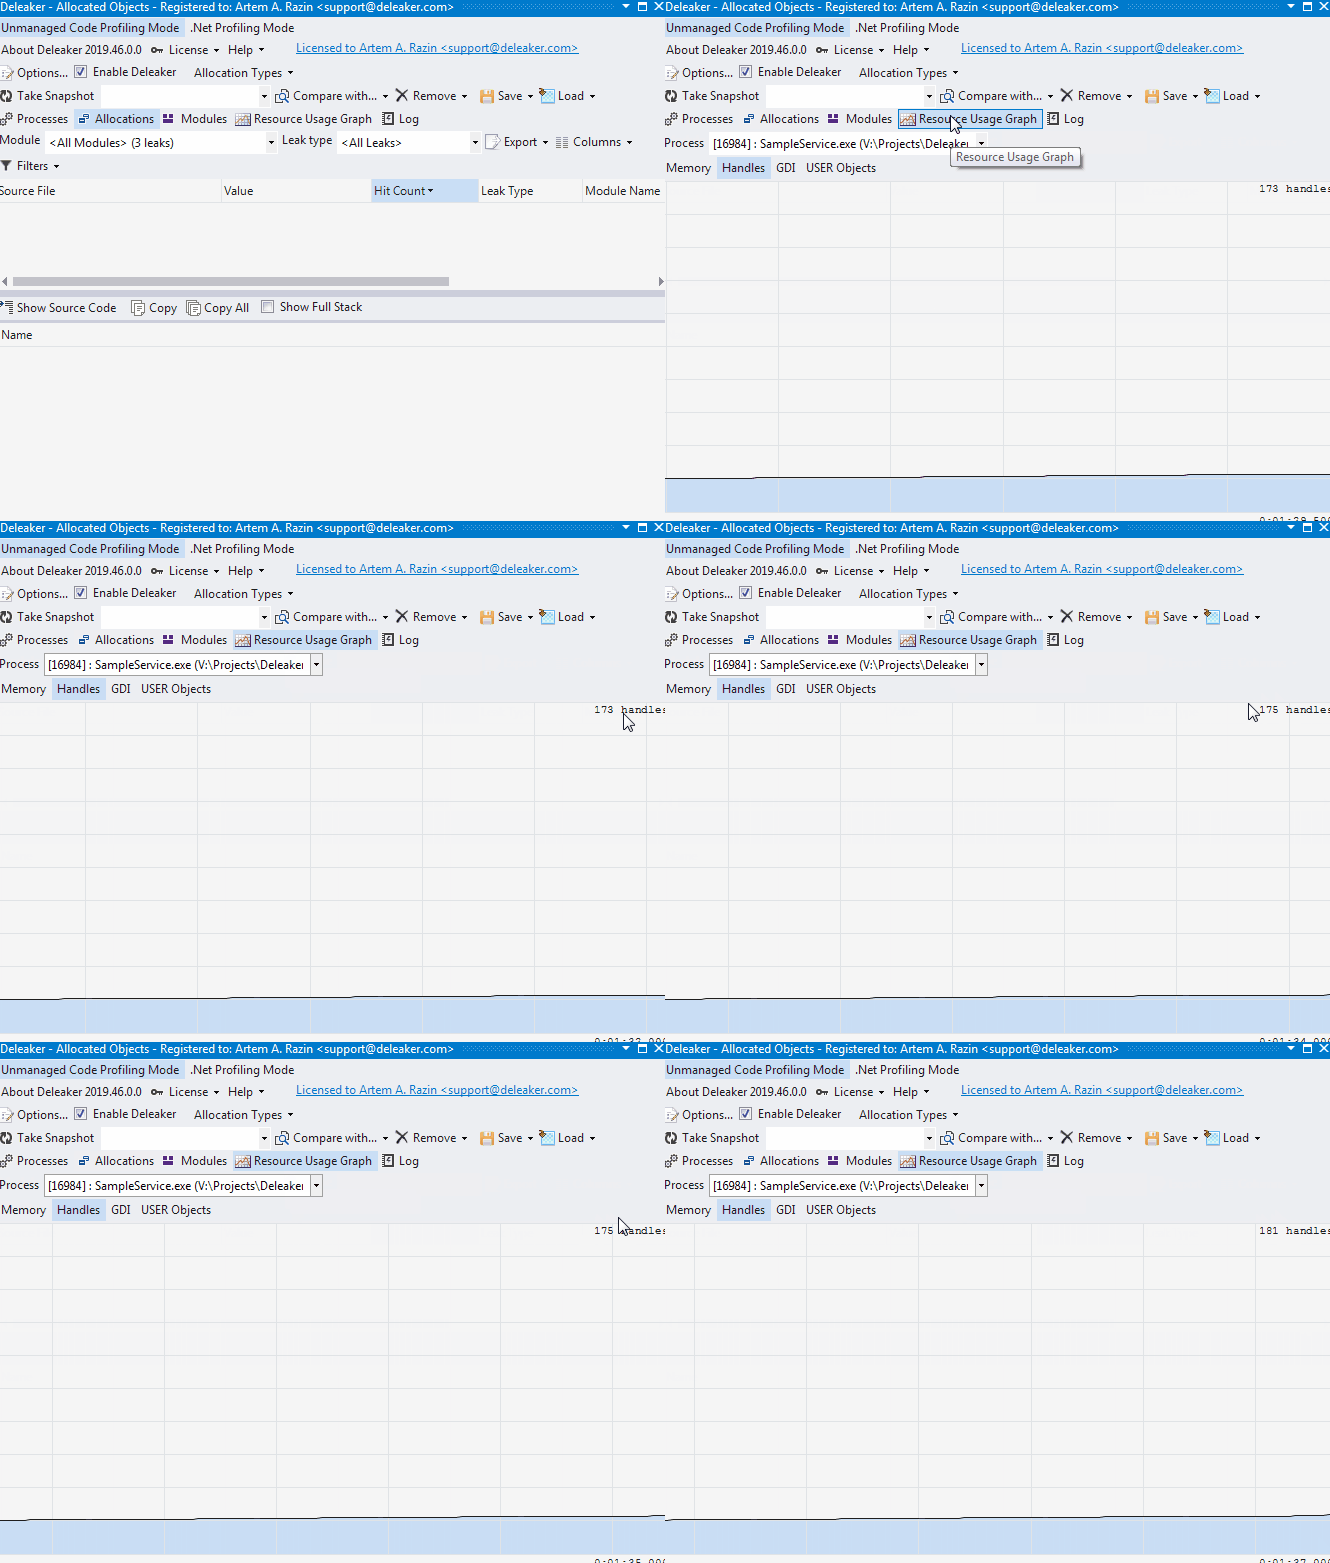
Now click to Extensions – Deleaker – Deleaker Window to open Deleaker and switch to Resource Usage Graph. It shows memory and handles leakage:
Let’s take a base snapshot, then let process allocate more memory and open some handles. After that take the second snapshot and compare the base snapshot (use Compare with…). Comparing snapshots helps you to find those leaks that occur again and again, it’s a typical scenario of resource leakage.
Now Deleaker displays some memory leaks and some handles that have to be closed:
To see where a leak is made, just double-click it, or select Show source code from context menu. Deleaker opens the source file at the line directly in the editor where the allocation is made. You don’t need to leave Visual Studio to fix leaks:
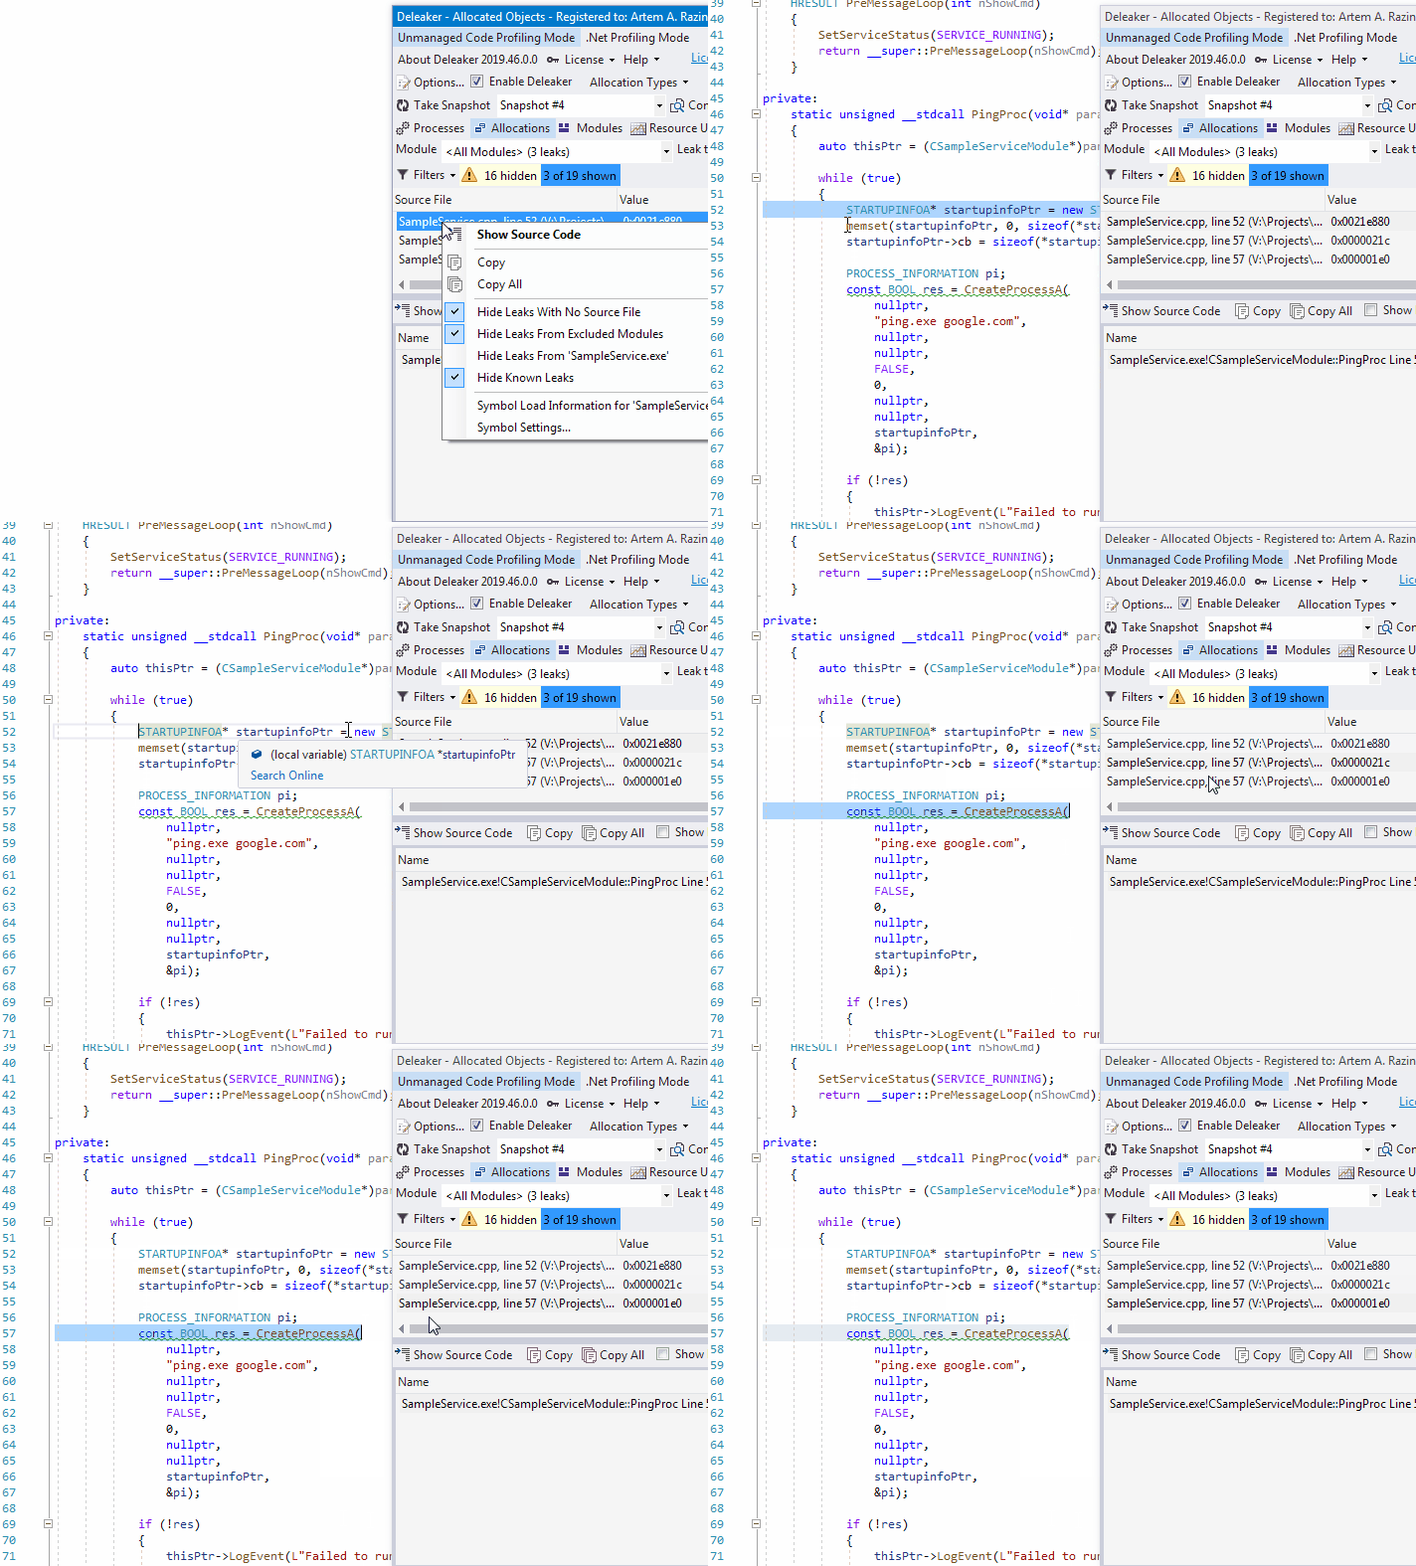
Of course, we have just forgotten close handles returned by CreateProcess, and haven’t released memory allocated for STARTUPINFO. Let’s apply the changes:
static unsigned __stdcall PingProc(void* param)
{
    auto thisPtr = (CSampleServiceModule*)param;

    while (true)
    {
        STARTUPINFOA* startupinfoPtr = new STARTUPINFOA;
        memset(startupinfoPtr, 0, sizeof(*startupinfoPtr));
        startupinfoPtr->cb = sizeof(*startupinfoPtr);

        PROCESS_INFORMATION pi;
        const BOOL res = CreateProcessA(
            nullptr,
            "ping.exe google.com",
            nullptr,
            nullptr,
            FALSE,
            0,
            nullptr,
            nullptr,
            startupinfoPtr,
            &pi);

        delete startupinfoPtr;

        if (!res)
        {
            thisPtr->LogEvent(L"Failed to run ping.exe");
            return 0;
        }

        WaitForSingleObject(pi.hProcess, INFINITE);
        DWORD exitCode;
        GetExitCodeProcess(pi.hProcess, &exitCode);

        CloseHandle(pi.hThread);
        CloseHandle(pi.hProcess);

        if (0 != exitCode)
            thisPtr->LogEvent(L"Failed to ping google.com");
        else
            thisPtr->LogEvent(L"google.com is reachable");
    }

    return 1;
}
Rebuild the project, register the service once again and start. Attach to the service process and take several snapshots. They are free of leaks, so no more leaks.
Conclusion
Deleaker is a memory profiler that helps to fix memory leakage as well as leaks of handles and other resources. Windows services profiling has always been a non trivial task. Fortunately, Deleaker can successfully attach to such processes to gather information about allocations.
Use Deleaker extension in development environment, or Deleaker Standalone in production environment. With Deleaker extension a developer can quickly fix leaks without exiting Visual Studio.