Why do you need C memory analysis tools?
Developers who write in C know how important it is to manage memory properly. Unlike languages such as C++ that can free memory implicitly or .NET languages that take over memory management, plain C requires the programmer to be careful when working with memory. In C, there are no checks when code reads or writes memory. If memory is allocated and a developer has forgotten to free it, C will be silent.
That is why C memory analysis tools are mandatory for developers and should be used daily in the development process. Memory analysis tools inform where memory was allocated, catch invalid memory access (buffer overrun and buffer overflow), chase attempts to free memory again (double free), and memory corruption. Most memory errors are the consequence of memory leaks.
Three ways to implement a memory analysis tool
Memory allocation and deallocation are made differently from one platform to another. This is the reason why leak detection tools are usually platform-specific. Below you will find tools for Linux and Windows. Also, there are several strategies to catch memory errors: hooks, source code instrumentation, and binary instrumentation.
Tools that use code instrumentation are named sanitizers and included in some compilers. When a compiler processes a line of code that either allocates or frees memory, or read/write to memory, the compiler adds additional code. It checks whether the memory is accessible, and also records an event of memory allocation and deallocation.
The code instrumentation works with a project’s codebase but it can’t help to catch errors in 3rd party modules.
The binary instrumentation is similar to source code instrumentation. Tools that use such kind of instrumentation, deal with machine code at runtime: when a module is loaded, the tool finds all instructions that work with memory and wraps them with additional instructions, validating read/write operations, and also stores information where some memory is allocated. This way is more generic and covers all modules loaded into a process.
The third way to monitor memory leaks is hooks. This is the fastest one because it almost doesn’t modify machine code, but just intercepts all calls that allocate and free memory and saves call stacks for each pointer along with other information like the size instead.
A memory analyzer for Linux
Valgrind is a memory analysis tool for the Linux platform that doesn’t work on Windows. You will see a Valgrind alternative below.
For the sample, let’s write a simple program that just make one allocation using operator new:
#include <iostream>

int main()
{
    new int;
    std::cout << "Hello world!" << std::endl;
    return 0;
}
Compile it using gcc:
gcc main.cpp -lstdc++
It should build a.out. Run it to test that it works well:
artem@ububtu-x64:~/projects/valgrind-test$ ./a.out
Hello world!
It may happen that Valgrind is not installed on your machine. In such a case install it using the package manager. On Ubuntu use:
sudo apt-get install valgrind
To profile the application by Valgrind run valgrind ./a.out, you will get the following:
artem@ububtu-x64:~/projects/valgrind-test$ valgrind ./a.out
==7206== Memcheck, a memory error detector
==7206== Copyright (C) 2002-2017, and GNU GPL'd, by Julian Seward et al.
==7206== Using Valgrind-3.16.1 and LibVEX; rerun with -h for copyright info
==7206== Command: ./a.out
==7206==
Hello world!
==7206==
==7206== HEAP SUMMARY:
==7206==     in use at exit: 4 bytes in 1 blocks
==7206==   total heap usage: 3 allocs, 2 frees, 73,732 bytes allocated
==7206==
==7206== LEAK SUMMARY:
==7206==    definitely lost: 4 bytes in 1 blocks
==7206==    indirectly lost: 0 bytes in 0 blocks
==7206==      possibly lost: 0 bytes in 0 blocks
==7206==    still reachable: 0 bytes in 0 blocks
==7206==         suppressed: 0 bytes in 0 blocks
==7206== Rerun with --leak-check=full to see details of leaked memory
==7206==
==7206== For lists of detected and suppressed errors, rerun with: -s
==7206== ERROR SUMMARY: 0 errors from 0 contexts (suppressed: 0 from 0)
As expected, Valgrind shows a leak of 4 bytes, i.e. size of integer. That’s correct because we allocated one integer.
To get call stacks of leaks run Valgrind with –leak-check=full:
artem@ububtu-x64:~/projects/valgrind-test$ valgrind --leak-check=full ./a.out
==7263== Memcheck, a memory error detector
==7263== Copyright (C) 2002-2017, and GNU GPL'd, by Julian Seward et al.
==7263== Using Valgrind-3.16.1 and LibVEX; rerun with -h for copyright info
==7263== Command: ./a.out
==7263==
Hello world!
==7263==
==7263== HEAP SUMMARY:
==7263==     in use at exit: 4 bytes in 1 blocks
==7263==   total heap usage: 3 allocs, 2 frees, 73,732 bytes allocated
==7263==
==7263== 4 bytes in 1 blocks are definitely lost in loss record 1 of 1
==7263==    at 0x4A3552A: operator new(unsigned long) (vg_replace_malloc.c:342)
==7263==    by 0x109182: main (in /home/artem/projects/valgrind-test/a.out)
==7263==
==7263== LEAK SUMMARY:
==7263==    definitely lost: 4 bytes in 1 blocks
==7263==    indirectly lost: 0 bytes in 0 blocks
==7263==      possibly lost: 0 bytes in 0 blocks
==7263==    still reachable: 0 bytes in 0 blocks
==7263==         suppressed: 0 bytes in 0 blocks
==7263==
==7263== For lists of detected and suppressed errors, rerun with: -s
==7263== ERROR SUMMARY: 1 errors from 1 contexts (suppressed: 0 from 0)
Great! Now we get the call stack:
0x4A3552A: operator new(unsigned long) (vg_replace_malloc.c:342)
0x109182: main (in /home/artem/projects/valgrind-test/a.out)
If you use Valgrind for a large application you may notice big performance degradation. Indeed, Valgrind uses instrumentation, that executes original machine code using a virtual machine. This way allows us to gather information about all memory accesses, allocations and deallocations.
Valgrind is a command-line tool only. It has no UI that is not handy if you have lots of leaks, or you experience a permanent leakage.
A memory analyzer for Windows
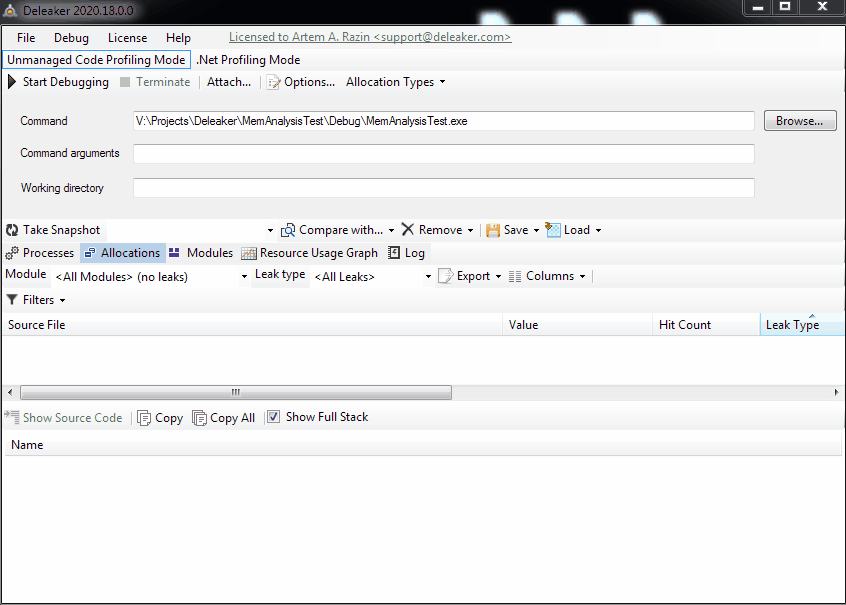
Deleaker is a memory analysis tool for Windows with a nice UI as well with a command-line tool. It doesn’t use code instrumentation, that’s why it is very efficient.
Let’s profile the same code that we have just used above. Create a new project in Visual Studio, write the code and build the project.
Run Deleaker Standalone, click to Browse…, and select the executable file. Click to Start Debugging. Deleaker launches the process, capturing allocations and deallocations. The process exits, and Deleaker automatically takes a snapshot that contains all allocations that haven’t been freed yet, these are leaks:
While the standalone version of Deleaker is great when one needs to find leaks on a client machine without debugging tools installed, the Deleaker plugin is a useful addition to an IDE for daily usage. If you use a modern IDE like Visual Studio, utilize Deleaker as a plugin. Deleaker supports all popular IDEs, including Visual Studio, Qt Creator, and RAD Studio.
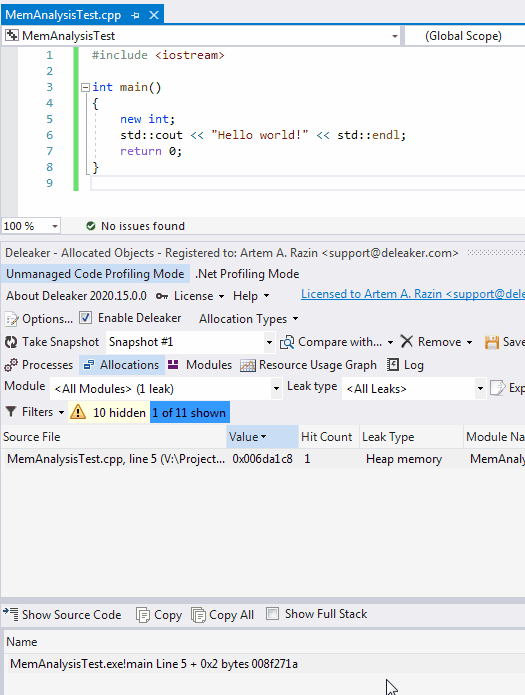
After integration, Deleaker is notified when an IDE starts and stops debugging. Let’s look at how the Deleaker extension works in Visual Studio. Load the project to Visual Studio and start debugging as usual. You will see Deleaker window pops-up: you can take a snapshot during the debugging at any moment.
Once the process exits, Deleaker takes a snapshot. To fix the leak, just right-click an allocation to go to the source code:
Wrapping up
Memory analysis tools are necessary for developers, especially those who write in plain C. Use them to find memory errors including leaks.
There are different tools for different platforms, using big variety of ways to find errors: source or binary instrumentation, hooks.
While Valgrind is a standard tool for Linux, developers consider Deleaker to be a prompt and an easy to use tool with a nice UI. Deleaker catches memory leaks as well as leaks of other resources: handles, GDI, and USER32. It integrates with almost all known IDEs to help developers fix memory leaks without leaving their favorite IDEs.