Unmanaged memory leaks in C#
Contents
- Why do unmanaged memory leaks happen in a .NET application?
- Symptoms of memory leaks
- How to fix unmanaged memory leaks in a C# application?
- How to find memory leaks with the help of WinDBG?
- The “disposable” pattern is a best practice to prevent memory leakage
- Unmanaged memory leaks made by the .NET runtime itself
- Conclusion
Why do unmanaged memory leaks happen in a .NET application?
Almost every developer sooner or later has to deal with the case, when the end-users or customers report that the application performs slowly, takes too much system resources like CPU, system memory, or both. Of course, there are many ways to monitor and profile every aspect of applications activity, but for now, we will explore the memory issues – how to detect, analyze and resolve them, in particular those related to unmanaged memory.
Before we move forward, it’s worth refreshing our understanding, how a typical .NET application makes use of system memory. In all cases, it consumes three areas of memory.
The first one is the Stack. It is a place where local variables, method parameters, return values are stored, while the application is running. Each thread has its own stack, hence having too many threads leads to extensive memory consumption. Stack holds the data of value-type variables and object references (a 32-bit or 64-bit integer) when an object is instantiated and stored on the managed heap. The space on the stack is reclaimed automatically when a method returns.
The second memory area is the Managed Heap. All managed objects live there and the memory they are using is reclaimed by Garbage Collector (GC) when they are not needed anymore. The CLR uses three generations of objects Gen0, Gen1, Gen3 (from youngest to oldest) to optimize the process of Garbage Collection and stores the large objects into separate Large Object Heap. GC keeps memory contiguous and relocates objects during their lifetime except Large Object Heap. We won’t pay great attention to GC today, because the third memory area will be of interest, namely the Unmanaged Memory Heap.
The Unmanaged Heap stores data like Microsoft Intermediate language (MSIL) instructions, JIT-compiled code, runtime data structures, method tables, and so forth. Besides this, the user’s code can allocate unmanaged memory directly by calling into unmanaged Win32 APIs or by instantiating COM objects. A more interesting case is the indirect allocation of unmanaged memory. Sometimes ordinary managed objects use unmanaged memory when they are created or in the course of their work. However, they may not care about freeing memory and may not provide any disposing options at all from the outside. The classic example is the XmlSerializer class, which generates dynamic assemblies to optimize its work, does not have Dispose or a similar method, and in some cases can cause significant leaks of unmanaged memory. We will definitely come back to this type later.
Symptoms of memory leaks
Let’s look at the possible symptoms of memory issues. It could be an application crash with OutOfMemoryException or poor responsiveness because of intensive virtual memory swapping to disk. Or it could be reports from system monitoring tools, stating sustained increase of memory usage during the application lifetime. In either case, the first task is to detect which kind of memory is leaking and investigate the problem memory domain in more detail.
One of the most suitable tools for it is the Windows Performance Monitor application. To get the initial understanding of the situation with the memory the following performance counters could be analyzed:
Process/Private Bytes – reports the total allocated memory.
.NET CLR LocksAndThreads/# – reports the number of logical threads. It is a quite rare but still possible case to have thread leaks, for example, having too many “blocked” threads, when each of them “hangs” awaiting certain condition, never exits and consumes its Stack memory, which in turn has the size of 1 MB by default or much more in case of many nested method calls.
.NET CLR Memory/# Bytes – reports the combined size of memory allocated for Gen0, Gen1, Gen2, and Large Object Heap, in other words, the total size of managed memory used by an application.
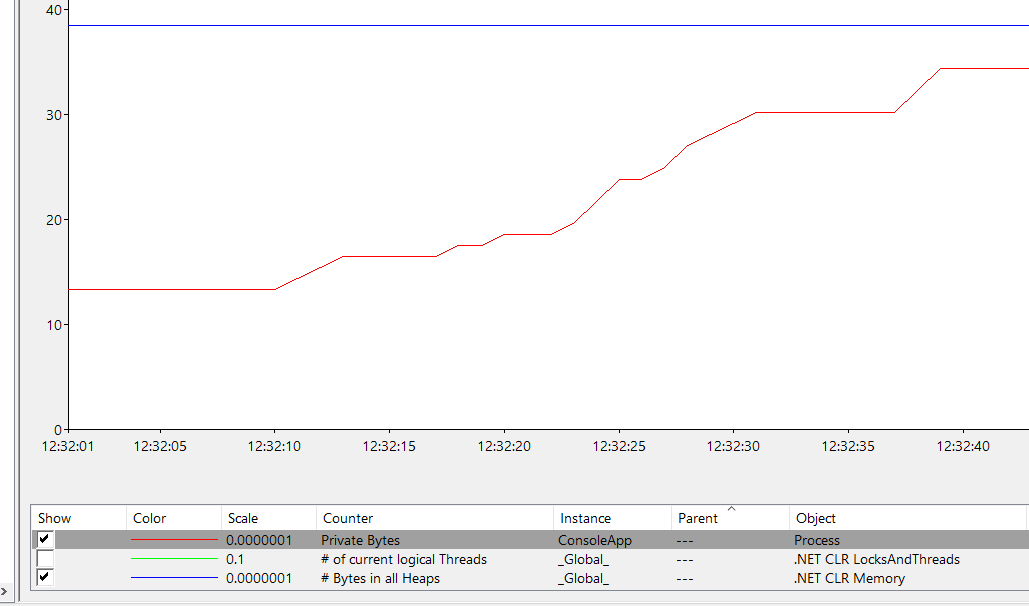
The screenshot above illustrates the case when the process gets more and more memory, but the size of managed heaps remains the same, that points to possible unmanaged memory leak.
How to fix unmanaged memory leaks in a C# application?
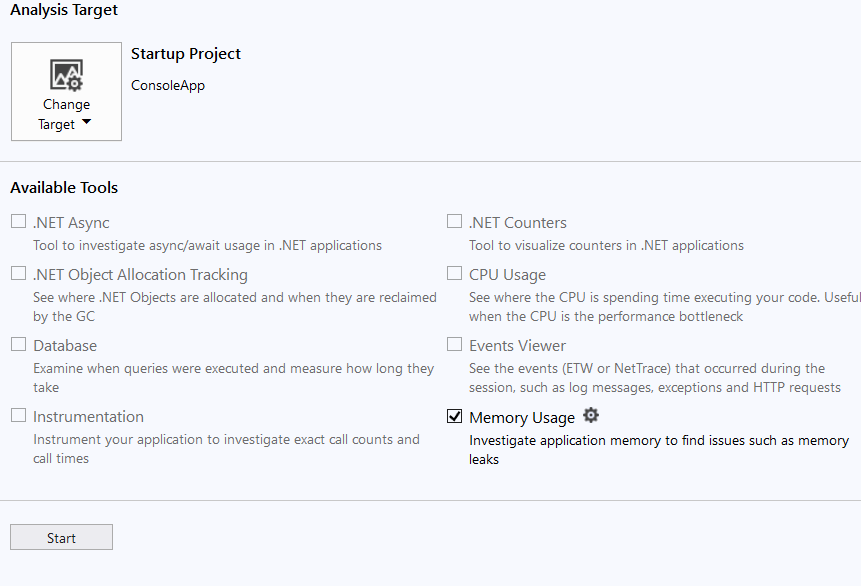
Another tool for memory leak detection is MS Visual Studio Performance Profiler. It can be started from Debug -> Performance Profiler menu in Visual Studio:
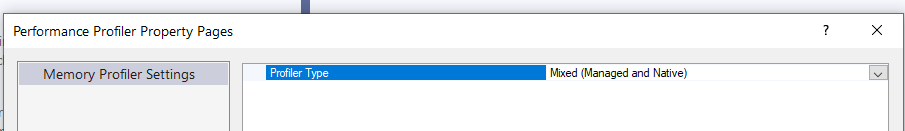
If unmanaged memory leaks should be investigated, make sure that the tool settings enable that:
As already mentioned .NET applications can allocate unmanaged memory directly using Win32 API function calls or wrapper classes from .NET framework BCL, for example, the System.Runtime.InteropServices.Marshal class, its AllocHGlobal method is a wrapper of LocalAlloc function from Kernel32.dll, which returns a pointer to the allocated memory.
Let’s run the allocating memory code and make two snapshots before and after the allocation of the list of memory blocks.
Console.WriteLine("Please make the first snapshot. Press any key when you are done");
Console.ReadKey();

var handles = new IntPtr[100];

for (int i = 0; i < handles.Length; i++)
{
    handles[i] = Marshal.AllocHGlobal(10 * 1024 * 1024);
}

Console.WriteLine("Please make the second snapshot. Press any key when you are done");
Console.ReadKey();
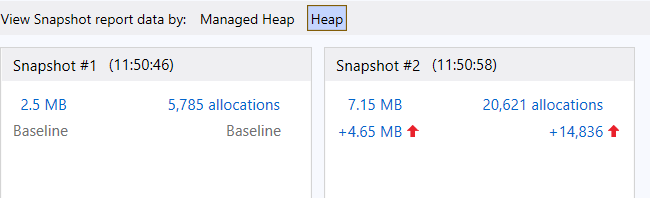
After running the code and stopping the profiler session, we get something like that:
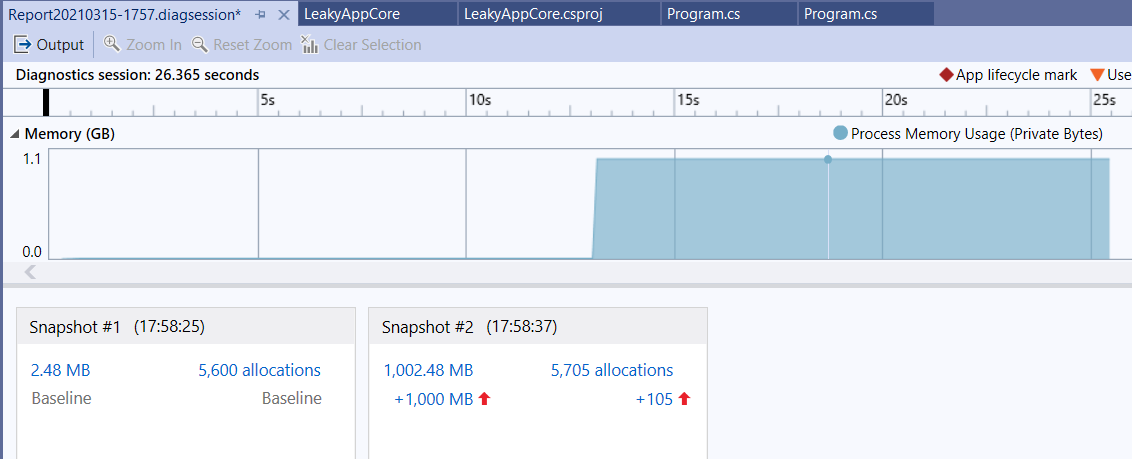
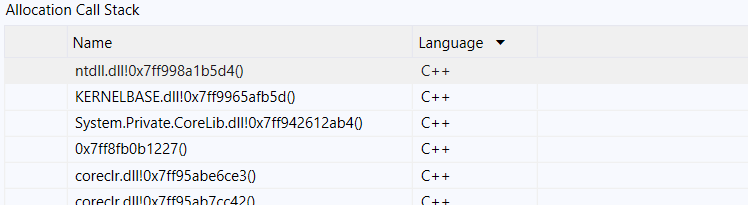
The tool makes us able to drill down into the snapshot and see differences between two states of application memory, including heap contents and allocations. It’s possible to order the most expensive first and see each Allocation Call Stack respectively:
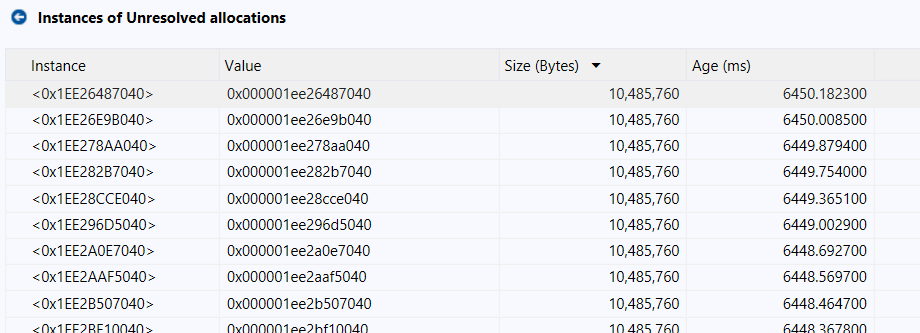
How to find memory leaks with the help of WinDBG?
Visual Studio Performance Profiler comes with Visual Studio out of the box and is free. However, it doesn’t give us comprehensive information on all aspects of memory usage. For example, in the code above, we allocated a certain number of blocks in memory and stored pointers to them in an array that itself resides in the managed heap and referenced by the local variable “handles” located on the stack. Performance Profiler in Visual Studio displays allocations as unresolved and in the call stack, it is not clear where exactly in the program code they have happened. Therefore, one needs a more sophisticated tool to investigate memory usage precisely. There are several well-recognized tools on the market, for example, Deleaker and WinDBG.
Most modern profilers are smart enough to map memory allocations from managed code to chunks of unmanaged memory and show which managed objects are using them. But there are times when the code contains bugs, for example, a pointer to the allocated memory is “lost”, or memory is not allocated directly – for example, managed code calls a native function via PInvoke, which in turn allocates memory during its operation, and possibly frees it incorrectly. In this case, it is rather difficult to understand the reason without knowing how it works under the hood. It is worth however to try to find the “leaky” place using WinDBG.
WinDBG is a multipurpose debugging tool for Windows operating system. It can be used to debug user applications, device drivers, and the OS itself in kernel mode. WinDBG supports debugging either attaching to running processes or analyzing memory dumps. Recent versions of WinDBG are part of “Debugging Tools for Windows”, which are free and can be installed with other tools from Windows Software Development Kit: https://docs.microsoft.com/en-us/windows-hardware/drivers/debugger/debugger-download-tools
Suppose we have a code like in example below
class Program
{
    static void Main(string[] args)
    {
        for (int i = 0; i < 100; i++)
        {
            AllocateMemory(10 * 1024 * 1024);
        }

        Console.WriteLine("Memory allocated. Press any key to exit");
        Console.ReadKey();
    }

    private static void AllocateMemory(int size)
    {
         Marshal.AllocHGlobal(size);
    }
}
It’s pretty pointless, it just allocates unmanaged memory and doesn’t use it in any way. Let’s try to run it and explore the memory usage with WinDBG.
First, we need to enable a user-mode stack trace database for an image. To do that run:
gflags.exe /i +ust
where gflags utility locates in C:\Program Files (x86)\Windows Kits\10\Debuggers\x64 or \x86 folder.
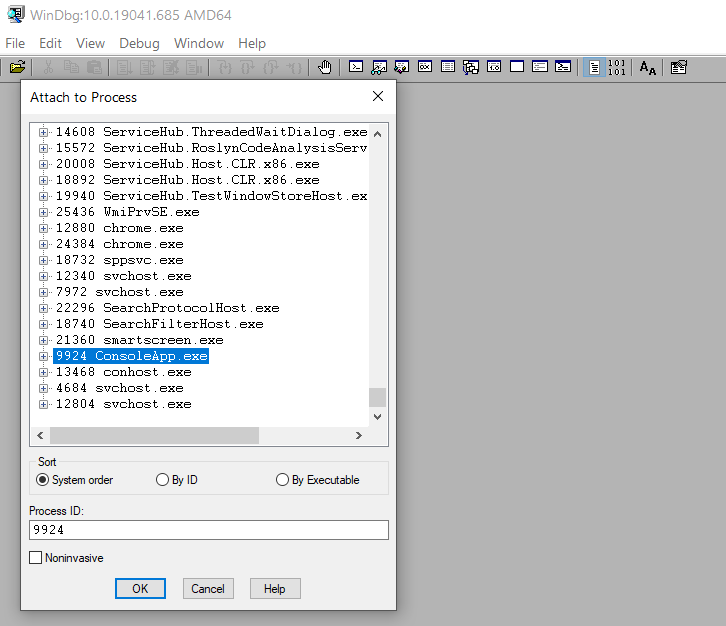
Second, we start our program, run WinDBG and attach to the Process:
After attaching we can explore the unmanaged heap. Below are the steps.
!heap -s
command displays unmanaged heap statistics:
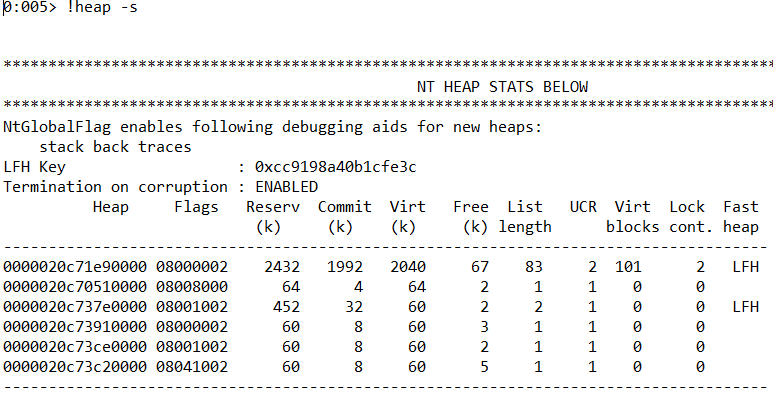
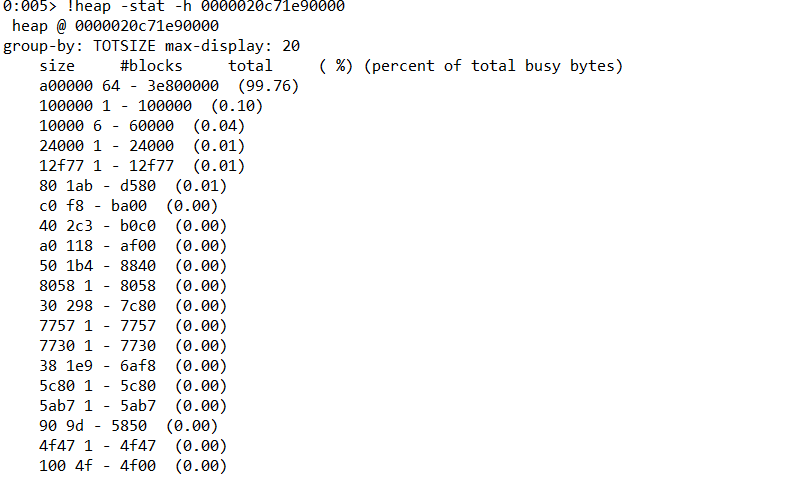
!heap -stat -h 0000020c71e90000 takes the first heap and displays its block allocations:
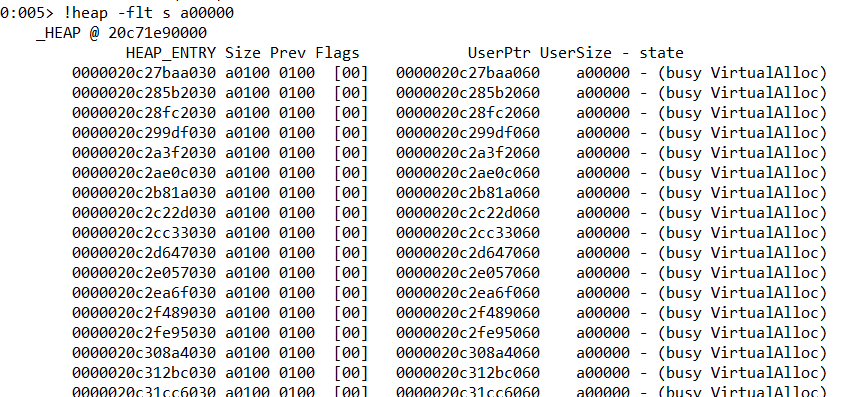
!heap -flt s a00000 displays only blocks of size a00000, which are most used and suspicious.
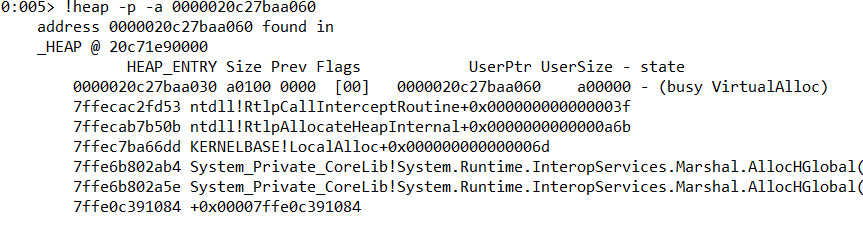
!heap -p -a 0000020c27baa060, we get call stack for the first block:
Quite informative, but we would like to see the exact place in the managed code where this memory allocation occurred. Since we are working with managed code, we need sos debugging extension for analysis. It must be loaded into a debug session before using it. If it is not yet installed, you can do so by downloading it from the Microsoft website: https://docs.microsoft.com/en-us/dotnet/core/diagnostics/dotnet-sos
To load it into debug session use:
.load %userprofile%\.dotnet\sos\sos.dll
command.
Once loaded we are able to use any sos command including ip2md, which displays method description structure at the specified address in code that has been JIT-compiled. Let’s do that:
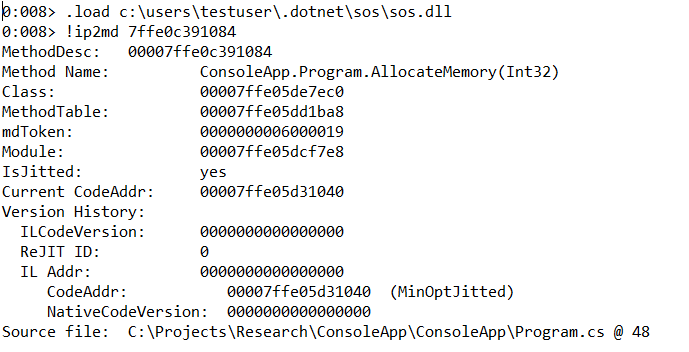
Of course, obtaining this information requires some effort and it is not so clear in comparison with the profilers’ reports. But we can still localize the place in the code where the memory was allocated and possibly solve the problem with its leak.
The “disposable” pattern is a best practice to prevent memory leakage
Let’s go back to the “disposable” pattern. It is needless to say, how important is correct design of types that allocate and use unmanaged memory. Users of the type should be aware that it is using unmanaged resources and also be able to release them. Therefore, one should consider making such types disposable implementing IDisposable interface. The presence of this interface tells the developer to call Dispose as soon as the object is no longer needed. Overriding the Finalize method allows us to call Dispose during garbage collection and free the resource even when one forgot to do it. In C# it’s not allowed to override the Finalize method explicitly. We should provide a finalizer by implementing a destructor (~) in our classes. This is how the implementation of the Dispose pattern as recommended by Microsoft could look like:
class UnmanagedMemoryWrapper : IDisposable
{
    private readonly IntPtr _handle;
    private bool _disposed;

    public UnmanagedMemoryWrapper(int size)
    {
        _handle = Marshal.AllocHGlobal(size);
    }

    ~UnmanagedMemoryWrapper()
    {
        Dispose(disposing: false);
    }

    protected virtual void Dispose(bool disposing)
    {
        if (!_disposed)
        {
             Marshal.FreeHGlobal(_handle);
             _disposed = true;
        }
    }

    public void Dispose()
    {
        Dispose(disposing: true);
        GC.SuppressFinalize(this);
    }
}
Let’s test both approaches against memory leaks using any tool we have discussed earlier:
Console.WriteLine("Please make the first snapshot. Press any key when you are done");
Console.ReadKey();

 //disposing
var wrappers = Enumerable
        .Range(0, 100)
        .Select(_ => new UnmanagedMemoryWrapper(1024 * 1024))
        .ToList();

wrappers.ForEach(x => x.Dispose());
wrappers = null;

 //instantiating unreachable objects and forcing garbage collection
Enumerable
        .Range(0, 100)
        .Select(_ => new UnmanagedMemoryWrapper(1024 * 1024))
        .ToList();

GC.Collect();
GC.WaitForPendingFinalizers();
GC.Collect();

Console.WriteLine("Please make the second snapshot. Press any key when you are done");
Console.ReadKey();
As we might expect, the code above doesn’t lead to any memory leaks, which can be easily verified using any of the available memory profilers. For more information on the implementation of the Finalize method and alternatives for the safe use of unmanaged resources, see the Microsoft documentation https://docs.microsoft.com/en-us/dotnet/api/system.object.finalize?view=net-5.0
Unmanaged memory leaks made by the .NET runtime itself
Let us now take a look at situations where unmanaged memory is used by the runtime itself, for example, when loading assemblies into the application domain, JIT compilation, and so on. You may ask how this can lead to memory leaks, because in the normal case, the type is loaded and compiled once, and then the compiled code is executed many times. This is true in most cases when the type used is uniquely identified by the runtime and it is unambiguously known which type is in use, for example, when we have ready-made .NET assemblies. However, this is not the case when we generate code dynamically during program execution and it is already our responsibility to ensure its reuse, or to provide the possibility of cleaning it, (for example, by loading the generated code into a separate application domain and unloading the entire application domain when we no longer need this code). Sometimes it is not at all obvious that the code is being generated somewhere inside and only later we get an unpleasant surprise in the form of a memory leak.
Let’s look at the following example. Let’s say we have a service that processes data from different sources, for example, about customers. The class, describing the customer looks like this:
public class Customer
{
   public string Id { get; set; }
   public string FirstName { get; set; }
   public string LastName { get; set; }
}
The data comes to us in the form of XML, but the names of the elements may differ, depending on the specific data source. Therefore, we will have to take this into account when deserializing data. Then the code could be like this:
public static Customer GetCustomer(string rootElementName, string xml)
{
   var xmlSerializer = new XmlSerializer(typeof(Customer),
                   new XmlRootAttribute(rootElementName));

   using var textReader = new StringReader(xml);
   using var xmlReader = XmlReader.Create(textReader);

   return (Customer)xmlSerializer.Deserialize(xmlReader);
}
Let’s make a test and check the program against memory consumption using an earlier technique with two snapshots:
Console.WriteLine("Please make the first snapshot. Press any key when you are done");
Console.ReadKey();

var xml = @"
<FabrikamCustomer>
    <Id>0001</Id>
    <FirstName>John</FirstName>
    <LastName>Dow</LastName>
</FabrikamCustomer>";

Enumerable.Range(0, 100)
     .Select(_ => GetCustomer("FabrikamCustomer", xml))
     .ToList();

Console.WriteLine("Please make the second snapshot. Press any key when you are done");
Console.ReadKey();
We look into the Visual Studio Performance Profiler report and see a noticeable increase in unmanaged memory usage:
Let’s use WinDBG. We’ll need the sos debugging extension again, so don’t forget to load it into the debugger before startings. After connecting to the process and loading the extension, execute the command !dumpdomain. The command enumerates all Assemblies, loaded into specified AppDomain or all domains in the application process:
![]()
In our case, we see a list of loaded assemblies where, in addition to static .NET assemblies, you can observe the so-called dynamic assemblies. There are exactly as many of them as the number of times we have deserialized an object from XML data:
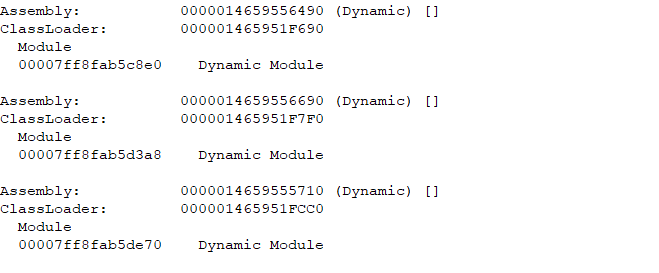
With the help of the following commands (!DumpAssembly /d and !dumpmodule -mt), we can analyze their content:
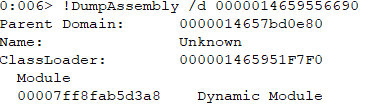
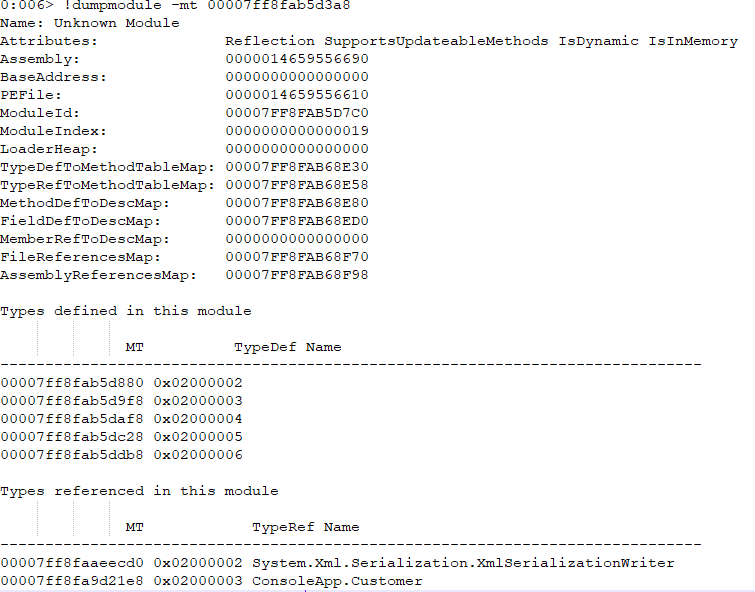
We can easily verify that the assembly data contains helper classes generated during the use of the XmlSerializer. That is, for each piece of XML data, an assembly has been generated and loaded into the application domain. Of course, when all the information about the type being serialized is statically known, this does not happen. In a situation where the XML structure needs to be accounted dynamically, the XmlSerializer does not assume this responsibility and just always creates a new assembly. Our code could be fixed as follows (for the sake of simplicity we don’t take care of thread safety):
public static Customer GetCustomer(string rootElementName, string xml)
{
   var xmlSerializer = GetSerializer(rootElementName);

   using var textReader = new StringReader(xml);
   using var xmlReader = XmlReader.Create(textReader);

   return (Customer)xmlSerializer.Deserialize(xmlReader);
}

static Dictionary<string, XmlSerializer> _cache =
   new Dictionary<string, XmlSerializer>();

static XmlSerializer GetSerializer(string rootElementName)
{
   if (!_cache.TryGetValue(rootElementName, out var serializer))
   {
      serializer = new XmlSerializer(typeof(Customer),
new XmlRootAttribute(rootElementName));
      _cache.Add(rootElementName, serializer);
    }
    return serializer;
}
One can follow the steps shown above and make sure that in this case only one dynamically generated assembly will be loaded into the application domain.
Alternatively, consider running the code in a separate application domain and unloading the domain after execution. This technique can be combined with the example above. The following code demonstrates this approach:
var xml = @"<FabrikamCustomer>
<Id>0001</Id>
<FirstName>John</FirstName>
<LastName>Dow</LastName>
</FabrikamCustomer>";

List<Customer> customers = null;

AppDomain appDomain = AppDomain.CreateDomain("AnotherAppDomain");

var program =
    (Program)appDomain.CreateInstanceAndUnwrap(typeof(Program).Assembly.FullName,
     typeof(Program).FullName);

customers = Enumerable.Range(0, 100)
      .Select(_ => program.GetCustomer("FabrikamCustomer", xml))
      .ToList();

AppDomain.Unload(appDomain);
Please note that the method Program.GetCustomer(…) is now an instance method, the type Customer is marked as Serializable:
[Serializable]
public class Customer { . . . }
and the Program class must inherit from MarshalByRefObject:
class Program : MarshalByRefObject { . . . }
As you might expect, after running out the profiling session, we see zero dynamically generated assemblies in the session’s summary.
Conclusion
We discussed possible cases of unmanaged memory leaks in .NET applications, and the tools available to detect and analyze such leaks. Once again, it is worth emphasizing how important an early testing strategy and monitoring application memory usage is. As we had the opportunity to see, problems can arise in seemingly completely harmless situations, and we hope that the knowledge presented in this article will help you in creating reliable and effective applications.