Contents:
- How to find out if a program has leaks?
- Why do C++ programs have memory leaks?
- How to find out where leaks happen?
- Conclusion
How to find out if a program has leaks?
There are several ways a developer realizes that his application has memory leaks. One day, an application crashes. A crash dump contains information about a thrown exception. Either it can be some standard C++ exception, std::bad_alloc, or “access violation”: a function failed to allocate memory, returning the null pointer, and later the application tried to write data to nullptr.
In another scenario, a developer notices that memory usage is constantly growing. Sometimes the Windows Task Manager helps explore memory usage. Another great tool is the Windows Performance Analyzer; it is more professional and has much more features compared with the Windows Task Manager: you can export collected information to review it later or to share with your colleagues. A memory profiler, Deleaker, also assists in exploring memory usage visually.
We can be certain that memory leaks cause noticeable effects like a process crash; after exploring memory usage visually, a developer has a reason to suspect leaks.
Why do C++ programs have memory leaks?
Memory leaks occur when memory is allocated but not freed when it is not required anymore. There are a few reasons why developers forget to release memory.
C++ is a programming language that allows writing programs at very different levels of abstractions. А developer can write in C++ using C-style, allocating memory using malloc, and a compiler says nothing as malloc is valid. But using malloc here and there is not an approach to writing an efficient C++ code. “Aha,” someone may say, “It’s a good idea to use C++ specific way to allocate memory, operator new.” Indeed, though C doesn’t have operator new, that’s not a good solution in any case.
Using raw memory allocations is an approach a C++ developer must avoid because it leads to considerable leaks. It is easy to explain. When you write malloc or operator new, you must care about where to free the allocated memory. If you are working on the program intensively, you just forget about it one day. While in plain C, you must be attentive, C++ provides the way to release memory automatically. Just follow a C++ way of managing memory, and most of the leaks will go away.
Developers who write in managed languages like C# or Java don’t allocate and free memory explicitly because the platform allocates and free memory itself. Switching to C++, it is easy to forget that this language doesn’t have a garbage collector that frees memory when it is not required. So we can say that C++ is somewhere between C, where memory is always allocated explicitly, and managed platforms (e.g., .NET or Java), where the runtime manages memory. C++ developers should keep an eye on memory allocations and use best practices to control memory. The core C++ idiom is RAII, which means “resource acquisition is initialization,” can be really helpful. In our case, resource acquisition (a memory pointer) is made in a constructor, and the resource is freed in a destructor. Moreover, C++ provides standard classes to manage memory in the RAII way: std::shared_ptr and std::unique_ptr. Instead of using raw operator new, “wrap” it by std::shared_ptr (std::make_shared is a helper function that allocates an object on a heap and returns std::shared_ptr). Compare:
auto objectPtr = std::make_shared<MyType>();
with:
auto objectPtr = new MyType();
// ...
delete objectPtr;
When the variable objectPtr goes out of scope in the first case, its destructor, std::shared_ptr::~shared_ptr, will be called. The destructor frees memory. In the second case, objectPtr should be explicitly released by the operator delete.
Sounds great, but what if, after code refactoring, the process is still leaking? It’s high time to investigate where the leaked memory is allocated!
How to find out where leaks happen?
You need to use a memory profiler to locate leaks. A profiler takes a memory snapshot that contains all required information to find leaks: their sizes, pointer values, and call stacks that help find the source.
There are several profilers available. WinDBG is a debugger developed by Microsoft. You can find a tutorial on how to use WinDBG to locate leaks here.
WinDBG is a powerful tool, but it is not easy to use. You need to enter a lot of commands to explore heap allocations. Also, you need to modify the system registry to tell Windows that call stacks should be recorded for heap allocations made by a particular application.
You can use another tool made for C++ developers, Deleaker, a memory profiler that finds native and managed leaks. You can download it from the downloading page. The standalone version of Deleaker works independently from an IDE. Also, Deleaker provides an extension for all major IDEs, including Visual Studio, Qt Creator, and RAD Studio. The extension allows investigating leaks without leaving your favorite IDE. Deleaker cooperates with the debugger, catching all allocations and deallocations. At any time while debugging (it does not matter if a debuggee process is running or stopped at a breakpoint), Deleaker can take a memory snapshot. Explore it immediately or export a snapshot to share with other developers. When a process exits, Deleaker takes a final snapshot. It contains allocations that haven’t been freed by the process.
Let’s start with the simplest leak:
int main()
{
    auto ptr = new int;
}
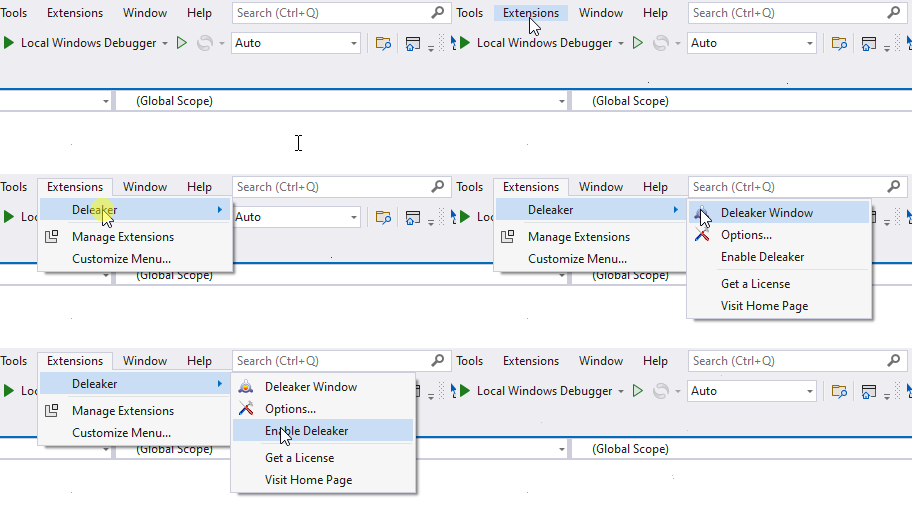
Build the project. Launch Visual Studio, create a new console application and type the code above. Then ensure that Deleaker is enabled. Use the Extensions – Deleaker menu to turn on Deleaker:
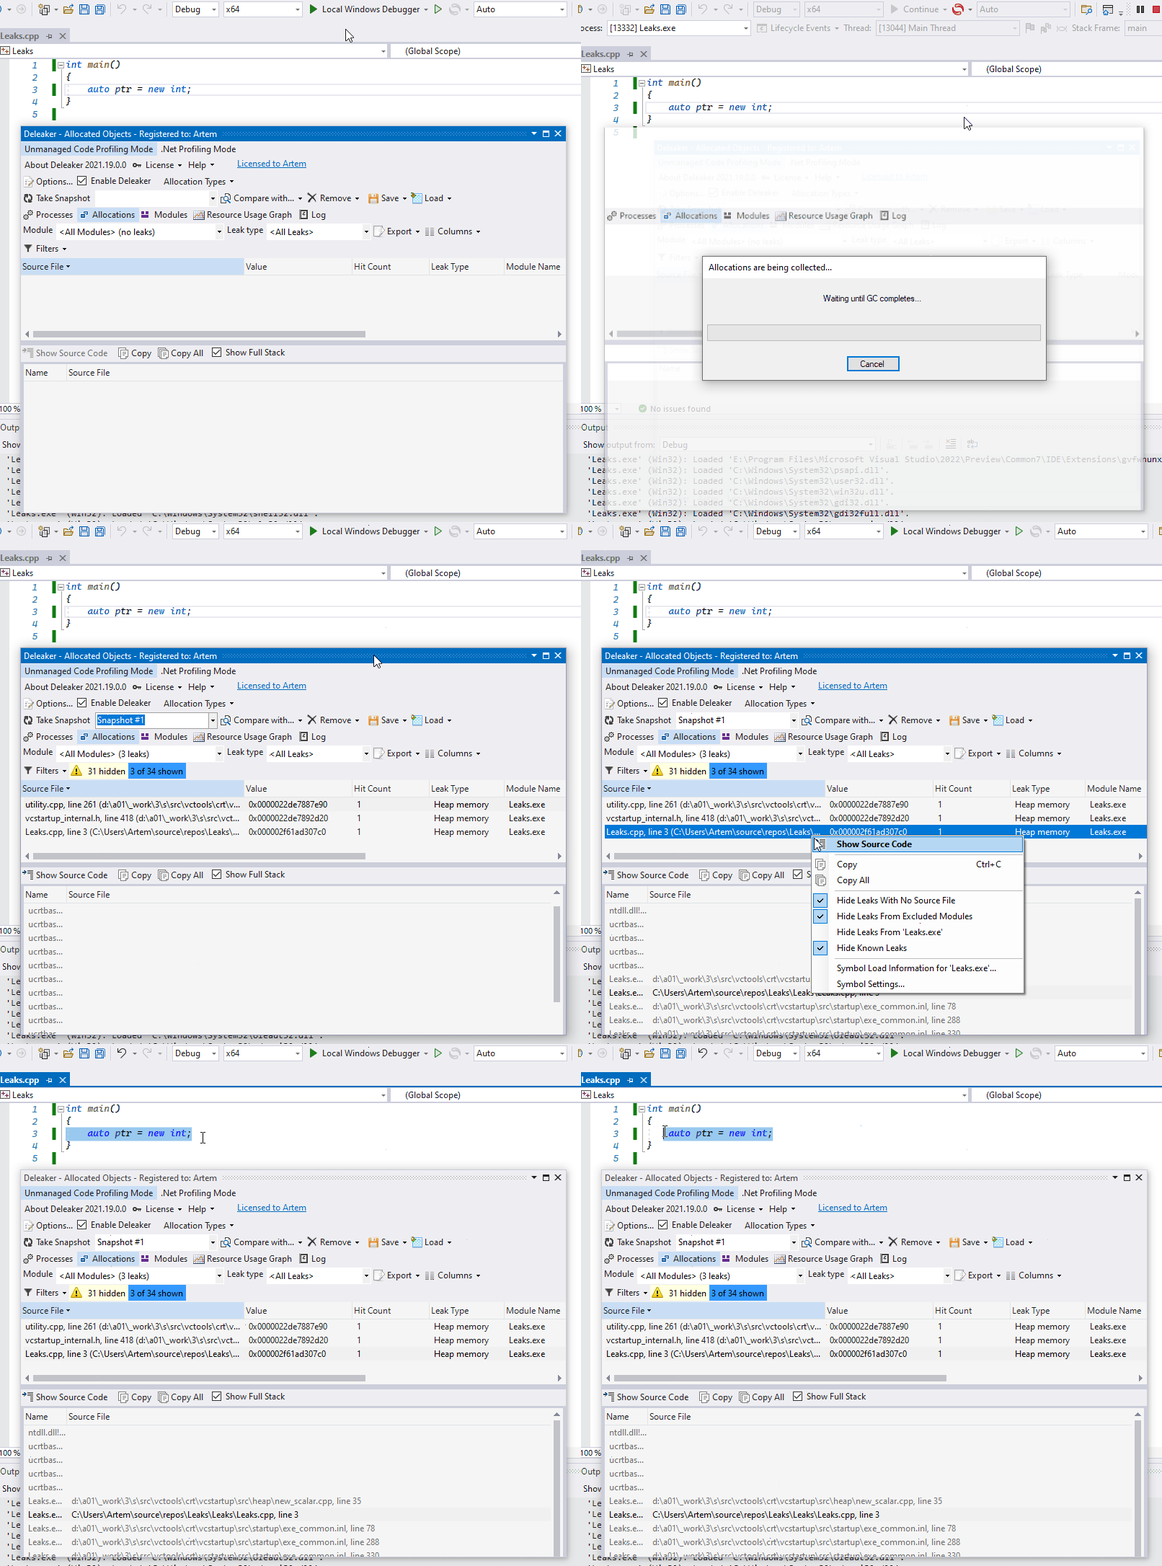
Start debugging and allow Deleaker to take the final snapshot. The snapshot contains the leak made by the operator new. Deleaker shows the exact line and source file path. Double-click the leak or use Show Source Code to go to the leak:
Let’s fix the leak. In this case, std::unique_ptr is enough as the pointer is not passed outside the function:
#include <memory>

int main()
{
    std::unique_ptr<int> ptr(new int);
}
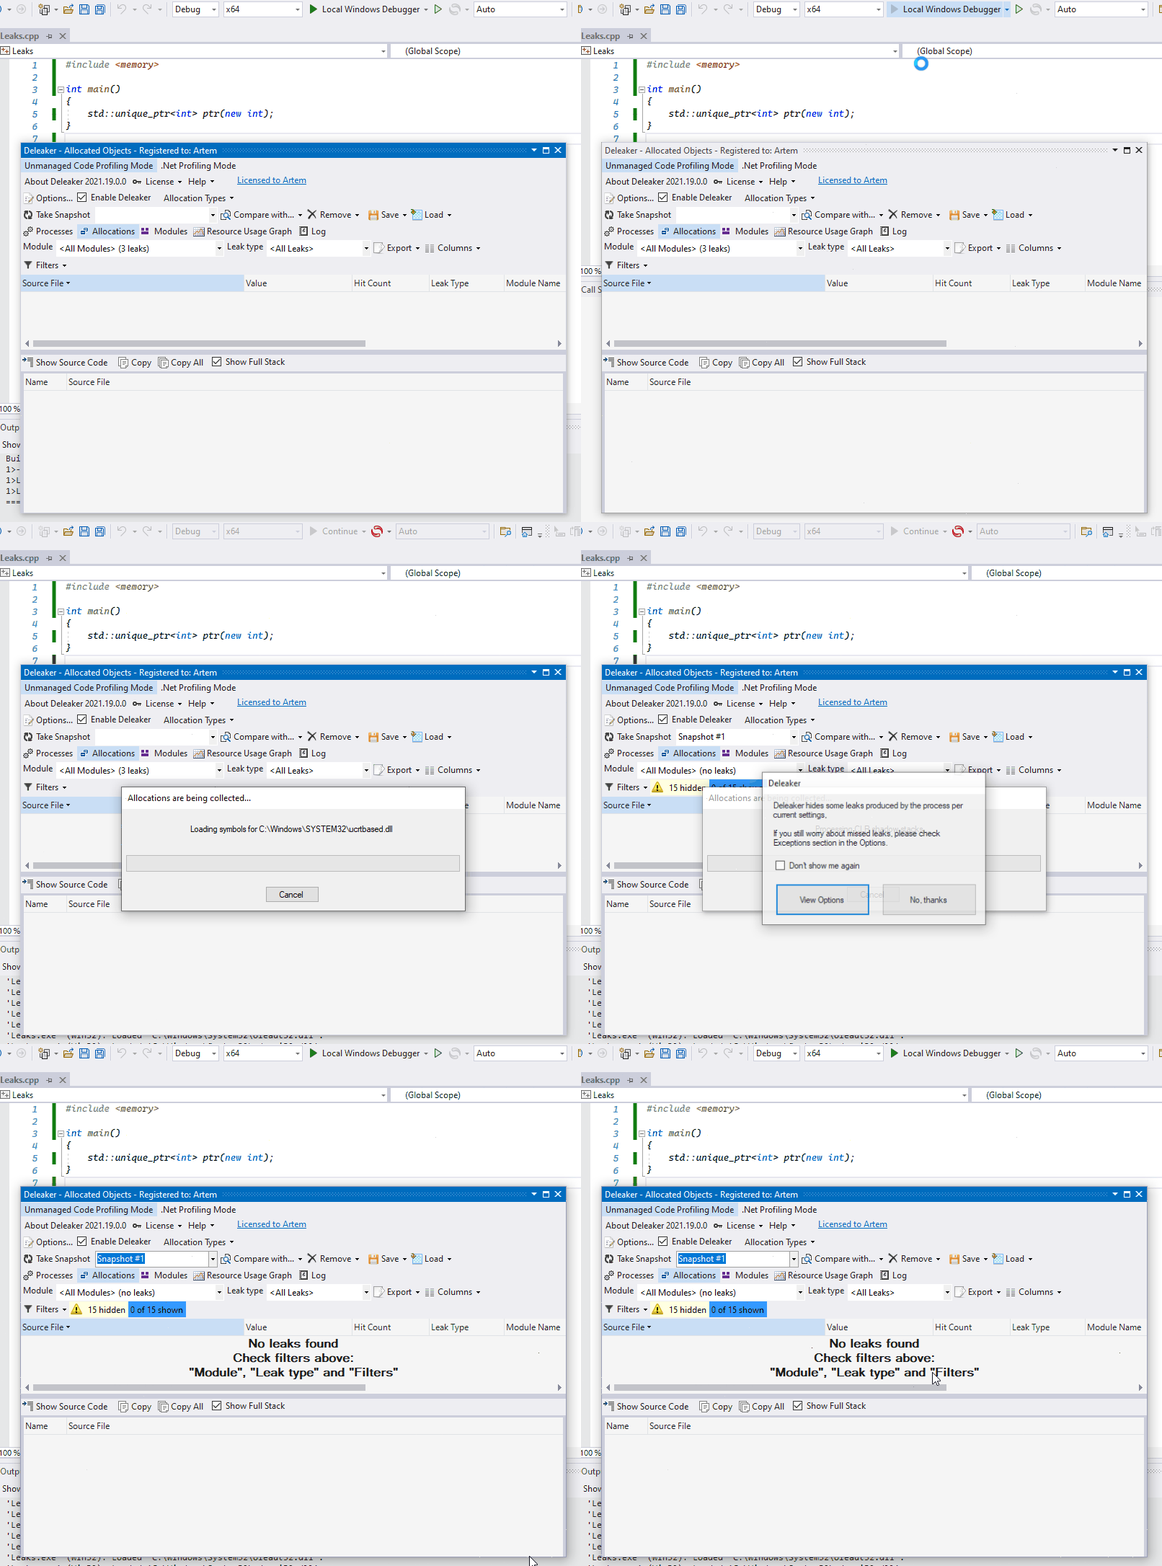
Run the debugging to ensure the leak has gone:
The next case is not so obvious as the Windows API is involved. Let’s simulate a failed call of CreateFileW because the file doesn’t exist. Then let’s output the error description to stderr. FormatMessageW returns a description for system errors:
#include <windows.h>
#include <iostream>

int main()
{
    CreateFileW(
        L"not existing file",
        GENERIC_READ,
        FILE_SHARE_READ,
        nullptr,
        OPEN_EXISTING,
        0,
        nullptr);

    auto const lastError = ::GetLastError();

    LPWSTR messageBuffer = nullptr;

    size_t size = FormatMessageW(
        FORMAT_MESSAGE_ALLOCATE_BUFFER | FORMAT_MESSAGE_FROM_SYSTEM | FORMAT_MESSAGE_IGNORE_INSERTS,
        nullptr,
        lastError,
        MAKELANGID(LANG_NEUTRAL, SUBLANG_DEFAULT),
        (LPWSTR)&messageBuffer,
        0,
        nullptr);

    std::wstring message(messageBuffer, size);

    std::wcerr << message;
}
At first glance, the code looks good. Let’s build and run:
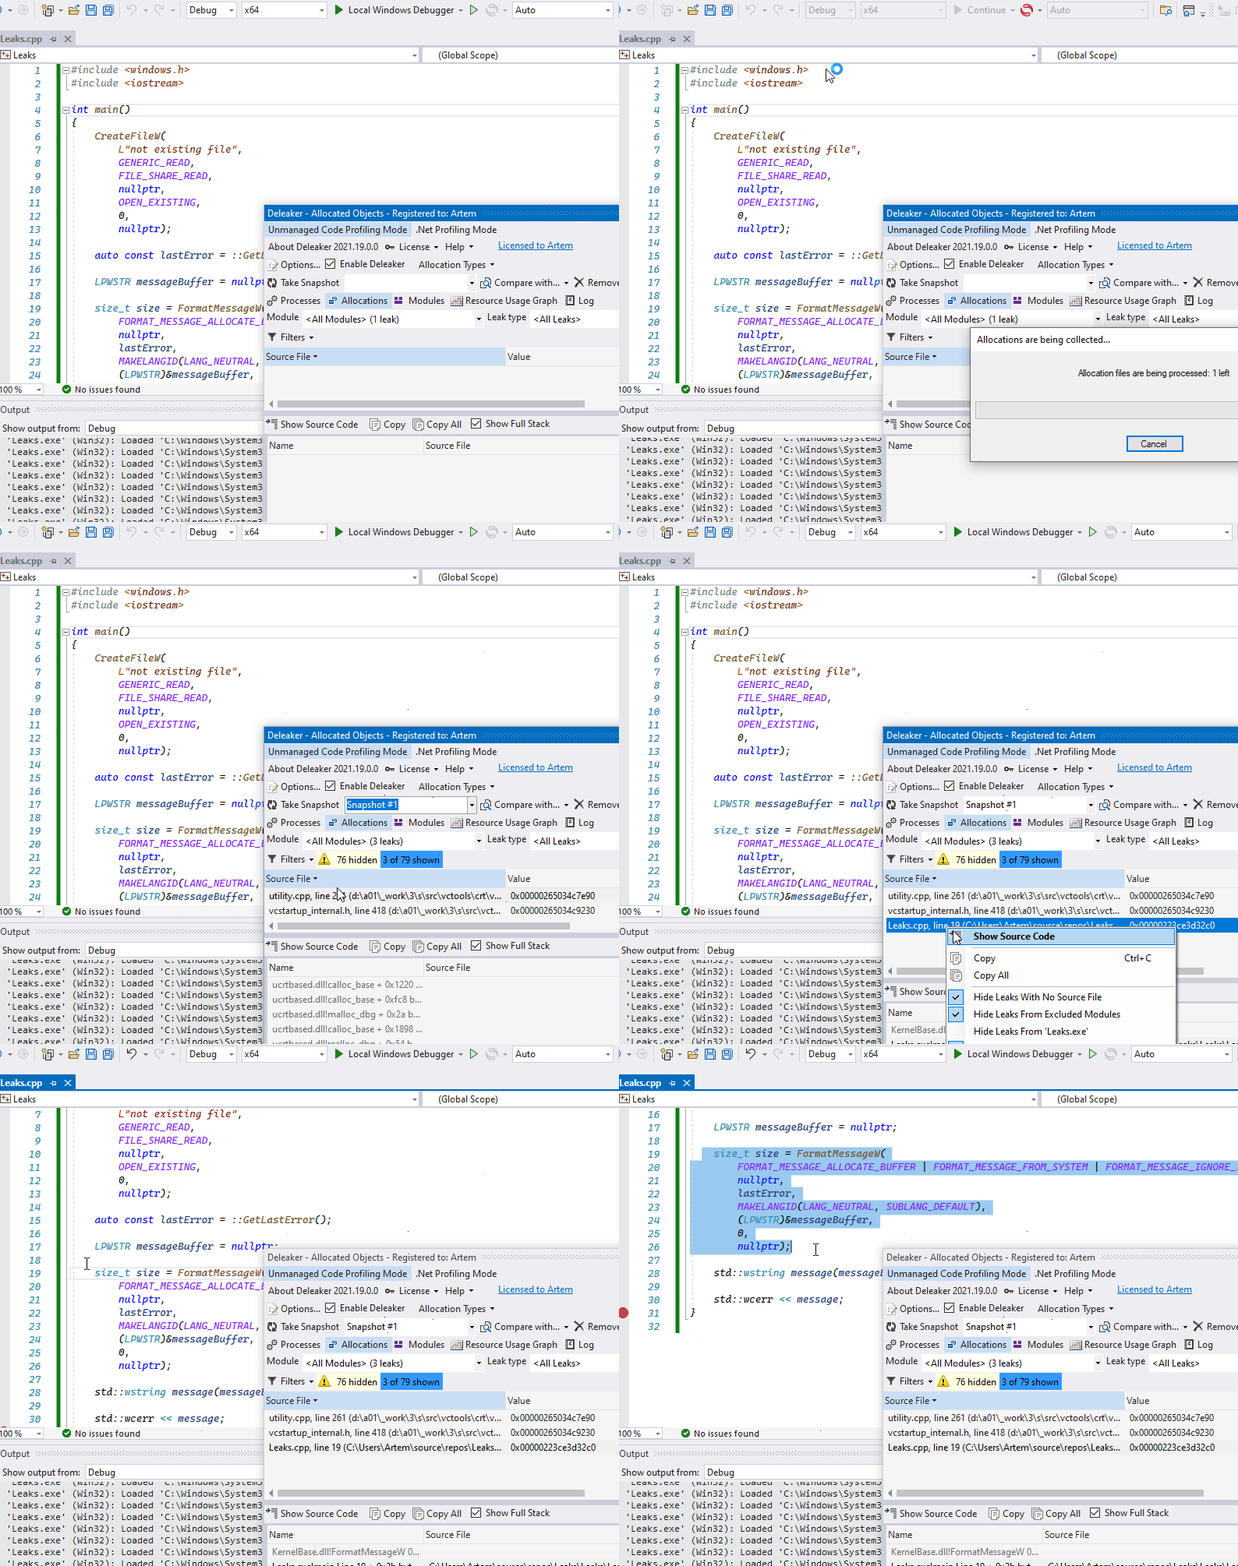
Deleaker has found a leak! Here is what the FormatMessageW documentation says about memory management:
The function allocates a buffer large enough to hold the formatted message, and places a pointer to the allocated buffer at the address specified by lpBuffer. The lpBuffer parameter is a pointer to an LPTSTR; you must cast the pointer to an LPTSTR (for example, (LPTSTR)&lpBuffer). The nSize parameter specifies the minimum number of TCHARs to allocate for an output message buffer. The caller should use the LocalFree function to free the buffer when it is no longer needed.
Indeed, we’ve forgotten about LocalFree. Let’s free it in C++ style using the std::unique_ptr with custom deleter function:
#include <windows.h>
#include <iostream>
#include <memory>
#include <functional>

// ...

    LPWSTR messageBuffer = nullptr;

    std::unique_ptr<decltype(messageBuffer), std::function<void(decltype(messageBuffer)*)>> messageBufferAutoDeleter
    {
        &messageBuffer,
        [](decltype(messageBuffer)* messageBuffer)
        {
            if (nullptr != *messageBuffer)
                LocalFree(*messageBuffer);
        }
    };
Build and run to ensure that no more leaks now:
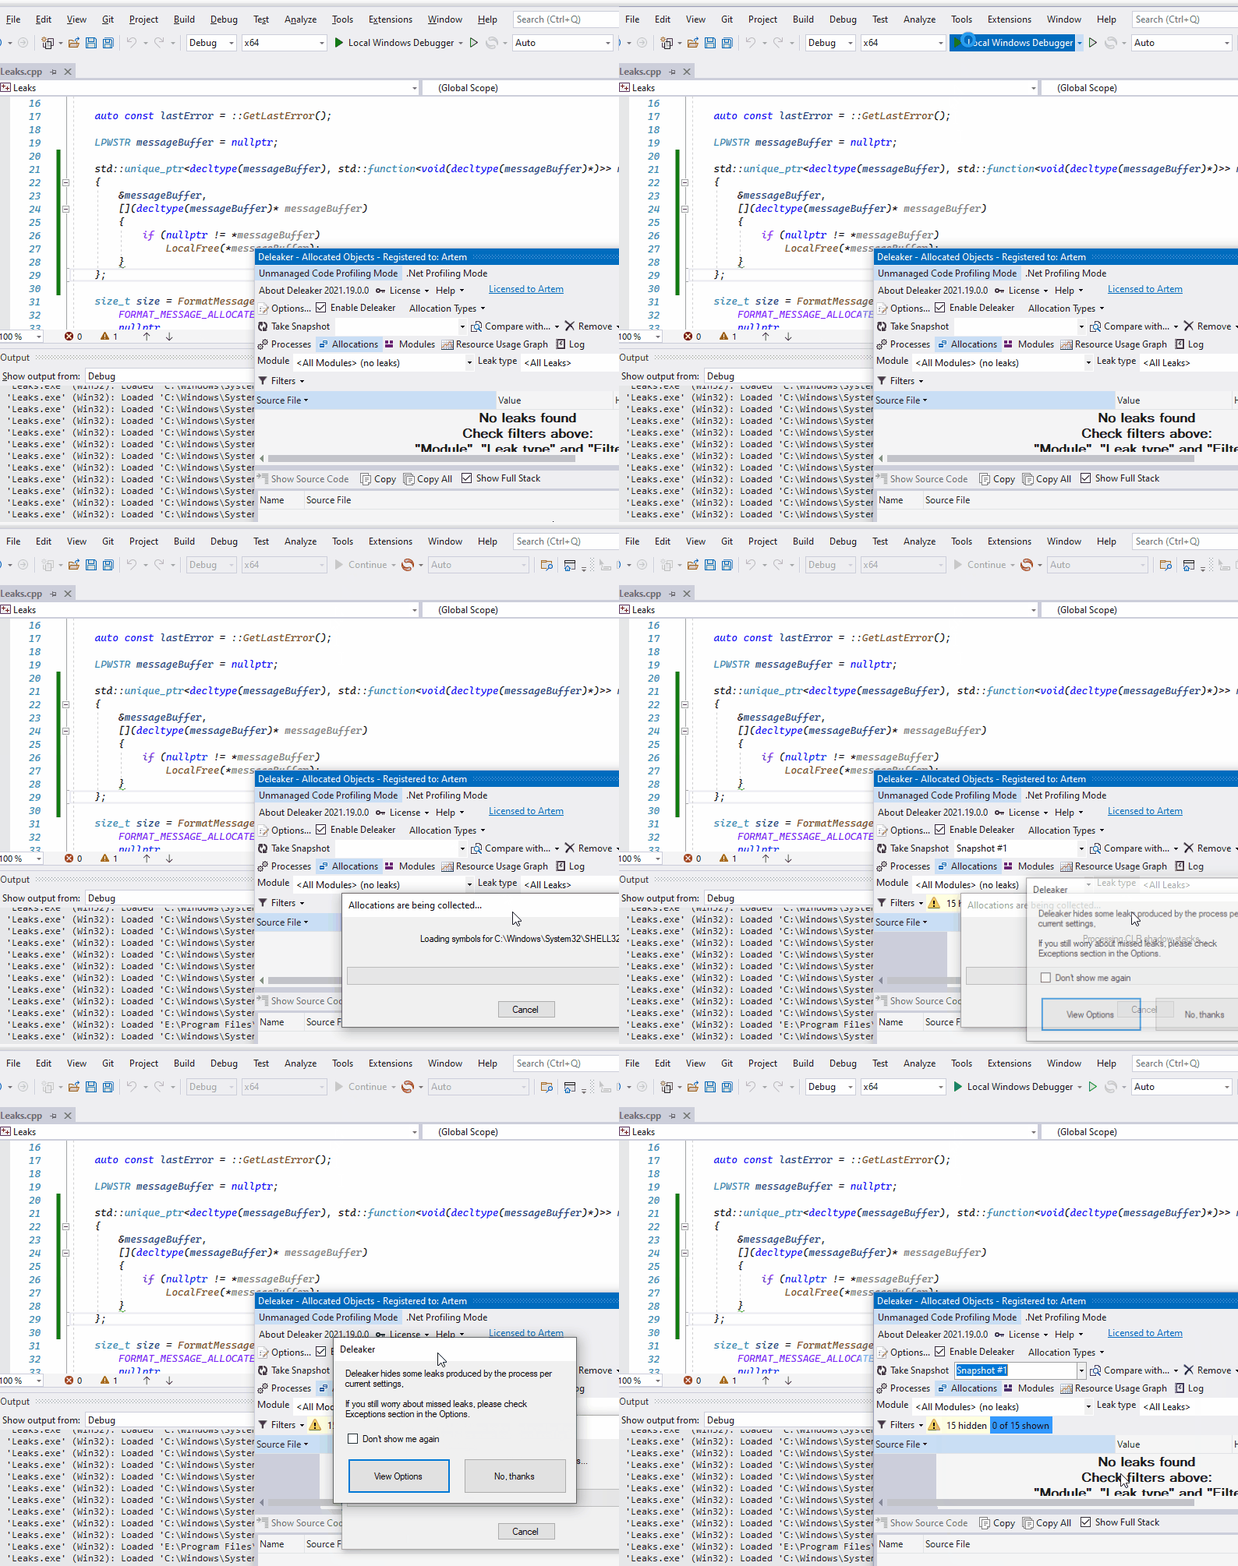
Great! Deleaker has reported no leaks now.
Conclusion
Although C++ allows managing memory explicitly, there are no reasons to allocate and free memory manually in most cases. With the help of smart pointers (std::unique_ptr and std::shared_ptr), memory is freed when the smart pointer variable goes out of scope.
Memory profilers help developers explore memory usage and locate leaks in C++ code. Standard profilers, e.g., WinDBG, are hard to use, especially for non-experienced developers; it requires a lot of commands to find leaks.
Deleaker is a swift memory profiler for C++. It works as a standalone tool and integrates with almost all C++ integrated development environments, including Visual Studio, RAD Studio, and Qt Creator.