Contents:
Memory management is a vital aspect of software engineering that most developers forget or ignore because of its high complexity. The variety of so many tools impede the right choice for the majority of developers. In this tutorial, you will learn how to use a memory profiler for Visual Studio to find memory leaks and fix them.
What is a Memory Profiler?
In computer programming, a profiler is an application to analyze programs at runtime. Memory Profiler is a tool to measure memory usage, capture allocated resources along with comprehensive information such as their size, detailed call stacks, and types.
Memory profiler helps you find memory leaks and unexpectedly large allocations in a program. A graph for analyzing memory usage is displayed in real-time to locate memory usage peaks. The analysis is carried out to identify whether memory use is typical or excessive.
Visual Studio is a favorite IDE for thousands of millions of developers worldwide, but unfortunately, its capability in memory profiling is minimal. Another standard tool, WinDBG, is trendy among experienced developers, but it takes significant time to learn. Also, a developer needs to leave Visual Studio, as WinDBG is a separate application.
Various debugging tools’ quality of information is not always sufficient to determine if some specific memory leak is happening in your program. Some of them collect data about heap allocations only; others provide incomplete call stacks.
You need a tool that provides results immediately, allows you to profile memory without leaving Visual Studio, and doesn’t require additional steps to enable profiling for a particular application.
Deleaker is a memory profiler that integrates with Visual Studio. Unlike similar tools, Deleaker doesn’t require modifying source code or system registry. Additionally, Deleaker finds leaks of handles, GDI, and USER Objects.
Using Memory Profile to Find Memory Leaks
First of all, download and install Deleaker. Then run Visual Studio and look if Deleaker is enabled or not. To enable or disable Deleaker, click on Extensions – Deleaker – Enable Deleaker. When you don’t need to find memory leaks, just disable Deleaker, and it will not bother you. When enabled, Deleaker cooperates with the standard debugger, gathering information about loaded and unloaded modules to get debugging information for each module and set required hooks to save all allocations.
If you want to know how many bytes each allocation has, take a snapshot. Snapshot is a list of allocations that are not freed at some time point. When you click on Take Snapshot in Deleaker, it stops execution and stores information about each allocation to a database, including call stacks. Once the snapshot is ready, the process continues execution.
Let’s look at how the memory profiler works. We will create a small application that doesn’t allocate memory directly but utilizes C++ smart pointers. However, it still has memory leaks because of cyclic references, so the reference counter of each smart pointer never becomes zero.
Imagine, you need to parse a file path and store directory names and the file name in some tree:
class Node : public std::enable_shared_from_this<Node>
{
public:
    Node() : Node("", nullptr) {}

    Node(const std::string& name, std::shared_ptr<Node> parent) :
        _name(name), _parent(parent)
    {
    }

    std::shared_ptr<Node> Add(const std::string& name)
    {
        auto node = std::make_shared<Node>(name, shared_from_this());
        _nodes.insert(std::make_pair(name, node));
        return node;
    }

private:
    std::string const _name;
    std::map<std::string, std::shared_ptr<Node>> _nodes;
    std::shared_ptr<Node> const _parent;
};

std::shared_ptr<Node> Parse(const std::string& path)
{
    auto root = std::make_shared<Node>();
    auto node = root;

    std::string s = path;

    size_t pos = 0;
    while (std::string::npos != (pos = s.find('\\')))
    {
        node = node->Add(s.substr(0, pos));
        s.erase(0, pos + 1);
    }

    return root;
}

int main()
{
    auto tree = Parse("C:\\Windows\\System32\\kernel32.dll");
}
The code looks good: no raw pointer allocations. Build the project, enable Deleaker and start debugging. The application has closed, and Deleaker has created a report. There are some leaks:
The call stacks point to allocations of Node instances. The reason is a child node keeps a reference to its parent node. The obvious solution is to use a weak smart pointer instead, provided by std::weak_ptr. Modify the code as shown below, changing the type of Node::_parent:
class Node : public std::enable_shared_from_this<Node>
{
...
    std::weak_ptr<Node> const _parent;
};
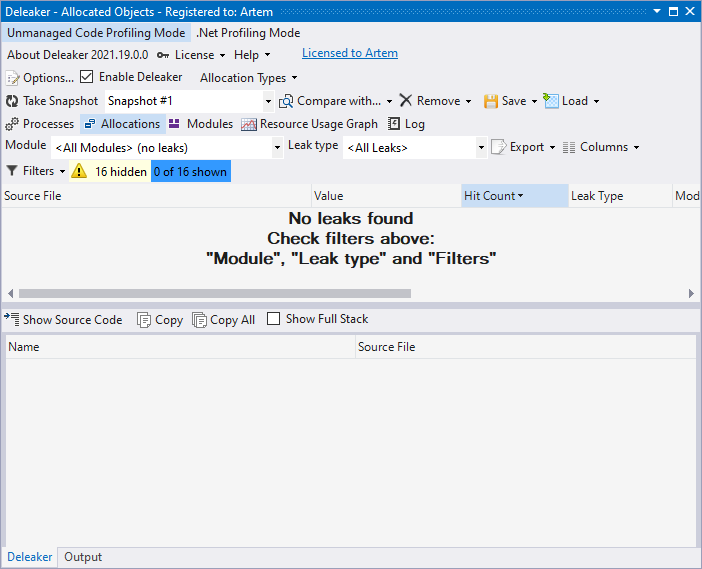
Rebuild the project and run. The snapshot is empty. No leaks found:
Conclusion
Following the C++ best practice is a must for developers, but memory leaks still happen. Cyclic references are a widespread scenario: objects just keep a reference to each other; that is why they are always kept in memory. In this case, weak references to the rescue.
A memory profiler takes snapshots so developers can explore live allocations. Call stacks give insights into where memory is allocated.
Visual Studio memory profilers, like Deleaker, integrate with the IDE to assist developers in profile memory usage and leak fixing.