Detection memory leak in C++
What are memory leaks, and why are they dangerous?
It’s no wonder, memory is limited like any other resource. 32-bit processes can allocate up to 2Gb; it is 8 TB for 64-bit processes, but practically memory is limited by hardware, as a result, it goes much less. That is why it is essential to free memory when you don’t need it; otherwise, the process will run out of memory or crash, which will affect usability.
It is especially dangerous when memory is constantly allocated in one place called again and again. At first glance, one small forgotten allocation is not a big problem but made a million times it quickly becomes a significant bug.
In C# or Java, the runtime assumes memory releasing for objects that are not needed anymore. In contrast, C++ developers must pay attention to memory management.
Detection memory leaks using C++ Runtime Library
Most memory allocations are made by standard C/C++ functions: malloc, calloc, operator new, operator new[], the rest are allocated by operating system API. In Visual C++, it is possible to tell C++ runtime to record the call stack for each such allocation. It works in debug builds only, though.
To enable leaks detection, you must define _CRTDBG_MAP_ALLOC in each source file before any #include statement. Insert _CrtDumpMemoryLeaks to display information about current allocations.
Consider the following sample:
#ifdef _DEBUG
#define _CRTDBG_MAP_ALLOC
#define _CRTDBG_MAP_ALLOC_NEW
#include <crtdbg.h>
#include <assert.h>
#endif

int main()
{
    int* ptr = new int;

    _CrtDumpMemoryLeaks();
}
Run it and switch to the Output Window in Visual Studio, you will see:
Detected memory leaks!
Dumping objects ->
{134} normal block at 0x00C79CB0, 4 bytes long.
 Data: <    > CD CD CD CD
Object dump complete.
C++ Runtime detected the leak but was unable to display the call stack.
Detection memory leaks using WinDBG
Windows allows the use of so-called debug heap for a particular application. To enable debug heap, you can modify the registry, but it’s much easier to use the tool gflags.exe. When the debug heap is on, a call stack is stored for each allocation made by HeapAlloc. Unlike the previous approach, this one works for debug and release builds. Moreover, it works even if the source code is not available. However, you still need to provide debugging information; they are usually stored in PDB files and generated by a compiler.
WinDBG is a debugger for Windows applications that can read additional information stored in a debug heap. WinDBG is a low-level tool with an interface implemented by the command line; it can be a bit difficult to use for beginners. Nevertheless, experienced developers often use WinDBG to fix memory issues. You can find a detailed guide on how to use WinDBG here.
Detection memory leaks using Deleaker
Deleaker is a memory profiler that doesn’t have the limitations of the above-mentioned methods. While C++ Runtime Library catches only leaks made by C++ functions within particular source files, Deleaker works on a process level, storing all allocations. Also, Deleaker doesn’t require modifying source code.
On the other hand, WinDBG requires enabling debug heap and outputs only a raw list of allocations; Deleaker has a friendly UI that helps quickly navigate to the source of a leak. A developer can swiftly switch between them using memory snapshots and check new allocations.
Deleaker can work as a separate application, but also it integrates with C++ IDEs, such as Visual Studio, Qt Creator, and Delphi with C++ Builder. Deleaker extends standard debugger capabilities, allowing you to investigate leaks without leaving your favorite IDE.
Let’s look at how Deleaker works!
First of all, install Deleaker from the downloading page.
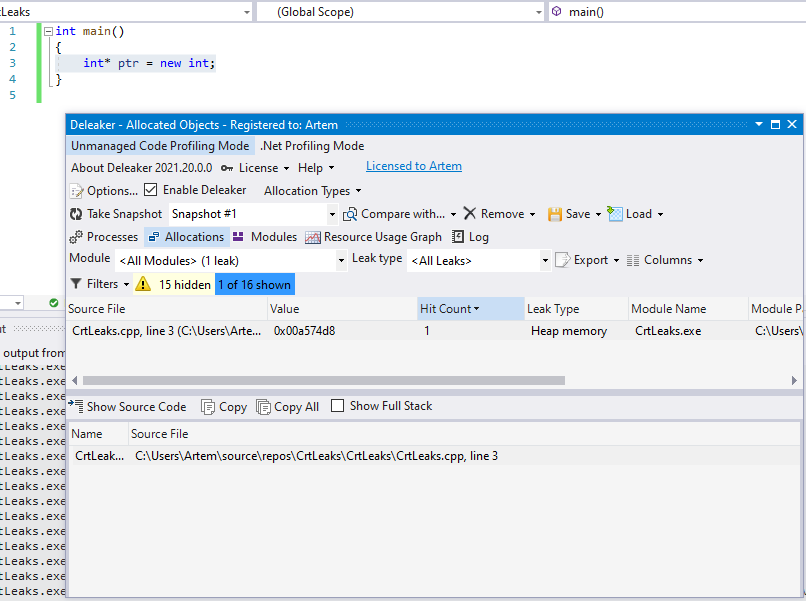
Create a console application, and introduce a simple leak made by the operator new:
int main()
{
    int* ptr = new int;
}
Ensure that Deleaker is enabled:
Start debugging. Let the application quit. Deleaker immediately starts taking a snapshot. This snapshot is taken after the process exits; it contains leaks, i.e., allocations that were not freed. A snapshot is an allocation list; each allocation has a size and call stack:
Conclusion
C++ developers often face memory leaks; it is vital to fix them as soon as possible. There are several tools available for developers to profile memory. C++ runtimes are able to catch leaks made by a program using malloc, calloc, and operator new. Another tool is WinDBG, a multi-purpose debugger that can read debug heap. Unfortunately, its capabilities are limited, and WinDBG’s UI is not handy.
Deleaker has a friendly UI, works as a plugin in C++ IDEs, and a standalone application. After taking a snapshot, a developer can review allocations and call stacks to fix leaks.