GDI leaks detection tool
Contents
- What are GDI leaks?
- How do I know if GDI objects are leaking?
- How to avoid GDI leaks?
- How do I monitor GDI objects?
- How do I fix GDI leaks?
- Bonus: How do I enumerate GDI objects programmatically?
- Conclusion
What are GDI leaks?
GDI is a part of Windows API that allows developers to draw graphics primitives in their applications. GDI provides tons of functions, including ones that allocate GDI objects (device contexts, pens, fonts, and others). In most cases, it is supposed that GDI objects don’t live long; instead, they should be created, utilized, and immediately released. The reason is a strict limit of GDI objects available for each process and all running processes: despite being private, GDI objects are still stored in a global table, which is relatively small. Microsoft claims it is 65536, but indeed it is lower. It is worth mentioning that one can change a per-process limit using the registry, but anyway, its maximum is 65536.
How do I know if GDI objects are leaking?
Sometimes, a developer visually realizes that an application works wrong: suddenly, visual elements are drawn incorrectly. Often it is a result of GDI leaks.
Two standard tools display GDI objects count: Windows Performance Analyzer and Task Manager. Windows Performance Analyzer has to be installed; Task Manager is always available. By default, Task Manager doesn’t show GDI objects count; you need to right-click the header, select Select Columns and choose GDI Objects:
Unfortunately, these tools show the total number only; you can find neither leaked GDI objects’ types nor their location. All that you can see is that the GDI objects count is growing.
That is why you need a profiler, a tool that dynamically analyzes a process to track GDI objects.
How to avoid GDI leaks?
Several rules help avoid GDI leaks. First of all, it is essential to release objects using a correct function; it depends on a GDI object’s type and how it was allocated.
Device contexts created by CreateDC, must be released by DeleteDC. Other device contexts, for example, created by GetWindowDC and GetDC, must be released by ReleaseDC.
DeleteObject releases pens, brushes, fonts, bitmaps, regions, and palettes.
If you allocated a device context using CreateDC and then passed the handle to DeleteObject, this would lead to leaks.
Unfortunately, painting operations are often done periodically due to their nature. One leaked object per operation becomes a big leak.
The second rule is: if a GDI object is selected to a device context, save the old object and select it back at the end of the operation.
If you are a C++ developer, you can avoid GDI leaks by using RAII:
#include <boost/core/noncopyable.hpp>
#include <windows.h>

class ClientDC : boost::noncopyable {
public:
    ClientDC(HWND hwnd) : _hwnd(hwnd), _hdc(::GetDC(hwnd)) {}

    ~ClientDC()
    {
        if (_hdc)
        {
            ::ReleaseDC(_hwnd, _hdc);
        }
    }

    HDC get() const { return _hdc; }

private:
    HWND const _hwnd;
    HDC const _hdc;
};
This ensures that GDI resources are released in destructors. You can write your own wrappers or use existing classes. For example, MFC includes CClientDC and CWindowDC classes.
How do I monitor GDI objects?
Visual Studio and other IDEs don’t have a GDI profiler. Still, fortunately, they can be extended by Deleaker, a tool to locate resource leaks, including memory leaks, leaks of handles, USER32, and GDI objects. With Deleaker, you can monitor GDI objects; you can review all required information, including handle value and call stack for each object.
Also, Deleaker works in standalone mode that is helpful when you need to find GDI leaks on a client machine that doesn’t have Visual Studio.
Let’s look at how Deleaker helps fix GDI leaks in action!
How do I fix GDI leaks?
Install Deleaker from the downloading page. You can install the standalone profiler or integrate it with your favorite IDE. Deleaker supports a wide range of IDE including Visual Studio, RAD Studio, and Qt Creator:
Let’s create a simple application with a GDI leak. Start Visual Studio, create a new console application, and add the following code that produces GDI leaks:
#include <windows.h>
#include <iostream>

int main()
{
    while (true)
    {
        CreateDCW(L"DISPLAY", nullptr, nullptr, nullptr);

        auto const gdiObjectsCount = GetGuiResources(GetCurrentProcess(), GR_GDIOBJECTS);
        std::cout << "GDI objects: " << gdiObjectsCount << std::endl;

        Sleep(500);
    }
}
Additionally, the application uses GetGuiResources to display the count of GDI objects. Build it and run:
Stop debugging and switch back to Visual Studio. Click to Extensions – Deleaker – Enable Deleaker to enable Deleaker:
Start debugging once again. Let the application run, return to Visual Studio, open Deleaker Window, and take a snapshot. It is a good idea to show GDI objects only (just select GDI Objects in Leak type):
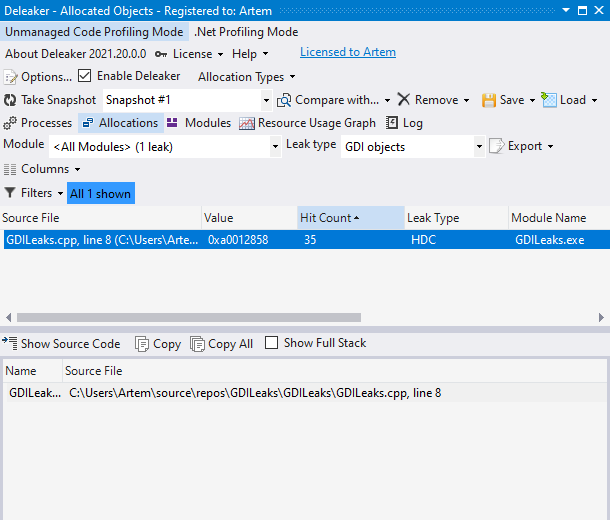
Deleaker finds the leaks of device contexts (HDC). GDI objects are grouped by their call stack; if objects are allocated at the same place several times, you will see a single entry in the list. Hit Count shows how many objects have been created there.
Under the object list, you can find the call stack. By default, Deleaker hides those entries for which Deleaker was unable to find source code information, but you can look at the entire stack. Just use the checkbox Show Full Stack. In our case, you can see that CreateDC allocated device contexts:
Bonus: How do I enumerate GDI objects programmatically?
We will show how to enumerate GDI objects created in the current process as a bonus. Please remember that this approach is not well documented, but it works properly for all Windows versions beginning with Windows XP.
An array of structures describe allocated GDI objects (usually called a GDI Table) in the address space of a process. It seems that GDI updates this array each time when the process creates a GDI object.
A GDI Table is a part of the process environment block (PEB). The offset depends on whether Windows is 32-bit or 64-bit. If a process is 32-bit running on a 64-bit Windows, it is important to read PEB from the 64-bit memory space of the 32-bit process. ntdll.dll!NtWow64QueryInformationProcess64 reads PEB for such a process. To read memory, use ntdll.dll!NtWow64ReadVirtualMemory64. In other cases, use ntdll.dll!NtQueryInformationProcess.
You can find complete source code demonstrating how to enumerate GDI objects on GitHub: https://github.com/Softanics/gdi-leaks.
Conclusion
GDI resources are strictly limited for a process. That is why it is vital not to have GDI leaks because they can ruin your application quickly. There are several rules of how to deal with GDI objects. But sometimes leaks happen. Standard debuggers, for example, Visual Studio’s one and WinDBG, don’t let developers review GDI objects. Unlike them, Deleaker shows a call stack for each GDI object. A developer finds where a particular GDI object was allocated; it allows to fix the leak almost immediately.