How to find memory leaks in MinGW32 and MinGW64?
In this article, we will show how to fix memory leaks in C++ if you use MinGW on Windows with the help of Deleaker, a memory profiler.
Contents
What is MinGW?
MinGW is a popular open-source toolchain to build applications for Windows. It includes a compiler (GCC) and headers required to utilize WinAPI. You can use MinGW from the command line, and in most C++ IDEs for Windows including Visual Studio, Visual Studio Code, Qt Creator, and CLion.
Why do you need a profiler?
Every C++ developer faces some memory leaks sooner or later. Beginners may forget to use smart pointers instead of operator new / operator delete or possibly even don’t know that operator delete is required; advanced developers may suddenly encounter circular dependency issues, or just abnormal memory usage.
Another kinds of leaks is Windows specific: leaks of GDI, User objects, and handles. They can be very substantial as their limits are pretty low. It is very easy to forget to release a GDI object and the application will freeze or crash unexpectedly.
That is why developers need a profiler, giving detailed information about allocated resources. Suddenly, if you use MinGW you encounter the lack of tools to detect memory leaks. Valgrind doesn’t work on Windows. WinDBG doesn’t support DWARF format: as MinGW was born in Unix world, it doesn’t produce debugging information in PDB format, which is a de-facto standard on Windows. Instead it produces debugging information in DWARF format, which unfortunately, isn’t supported by Windows utilities.
Fortunately, Deleaker works on Windows and supports DWARF format. Let’s see how Deleaker works.
How to fix a memory leak?
You can edit files manually but it’s much better to use some IDE. In this tutorial, we will use Visual Studio Code. You can learn how to configure the IDE to use GCC compiler from MinGW64 here.
Open Command Prompt, create a folder “mingw-leaks-sample”, and run code . to start Visual Studio Code in this folder.
Create a new file main.cpp with the following code that produces a leak:
int main()
{
    auto const* p = new int;
}
From the main menu, choose Terminal – Configure Default Build Task and select g++. It creates tasks.json. Return to main.cpp and choose Terminal – Run Build Task…
If the building has finished successfully you will see:
> Executing task: C/C++: g++.exe build active file <

Starting build...
V:\msys64\mingw64\bin\g++.exe -fdiagnostics-color=always -g V:\Projects\mingw-leaks-sample\main.cpp -o V:\Projects\mingw-leaks-sample\main.exe

Build finished successfully.

Terminal will be reused by tasks, press any key to close it.
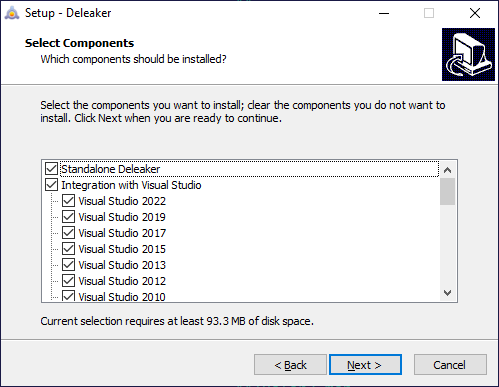
It is time to install Deleaker. Download the installer at the downloading page. Start the installer and ensure that Standalone Deleaker is selected:
After installation, run Deleaker. Click on Browse… and choose main.exe. Then click on Start Debugging. Let the program exit. Deleaker takes a snapshot that contains those allocations that hasn’t been freed yet:
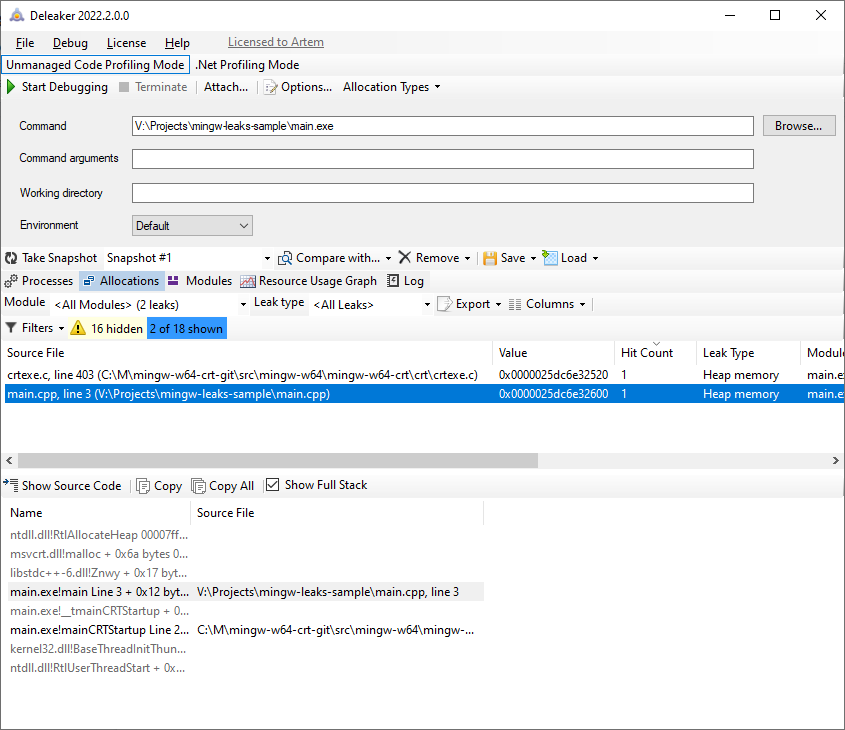
Great! Deleaker has found the leak and is showing the correct source file and line number.
Wrapping up
MinGW becomes more and more popular among C++ developers, but it produces debugging information in DWARF format that most Windows tools (for example. WinDBG) do not support.
Fortunately, Deleaker recognizes DWARF format as well as others including PDB, a standard format from Microsoft.
With the help of Deleaker you can profile any application to locate leaks quickly and efficiently. Snapshots contain allocations with detailed information including memory address, size, hit count, and call stack.
Deleaker supports both 32-bit and 64-bit applications and integrates with most IDEs including Visual Studio, Qt Creator, and RAD Studio. You can get a fully-functional demo on the downloading page.