Developers often ask why they need memory profilers like Deleaker if FastMM catches leaks in Delphi very well. In this article, we will show the limitations of FastMM and cases when a memory debugger can quickly help to fix leaks that FastMM does not report.
Contents
- What is FastMM?
- FastMM never reports about all memory leaks.
- FastMM never reports about GDI and handles leaks.
- Deleaker finds memory leaks, GDI, User and handles leaks.
- FastMM doesn’t have a UI.
- Deleaker has a friendly UI.
- FastMM doesn’t know about snapshots.
- FastMM doesn’t know about allocations made by the 3rd party code.
- Conclusion
What is FastMM?
Memory is allocated on a heap in applications, written in programming languages with manual memory management. Operating systems provide API in order to allocate virtual memory (on Windows: VirtualAlloc, VirtualFree). While a heap can give you even one byte, you can only take large blocks (e.g., at least 64K per one call) using virtual memory. Windows additionally provides the default heap (HeapAlloc, HeapFree).
Usually languages come with runtimes that either provide an implementation of a heap or use system-provided functions. Old Visual C++ runtime used to provide custom ones. Later versions used the default Windows heap that became more efficient.
Delphi’s standard memory manager is FastMM (C++ Builder uses it too). Besides being speedy, it can also record information about allocated memory in order to help developers find leaks.
You may wonder why you need any memory profiler if FastMM provides everything out of the box. Let’s look at the abilities of FastMM and compare it with Deleaker, a profiler that supports C++, .NET, and other languages besides Delphi.
FastMM never reports about all memory leaks.
Let’s look at how any Delphi memory manager works. A memory manager implements several functions that allocate and free memory; implementation details are hidden. When your program calls GetMem, the current memory manager returns the requested amount of memory. But if you call SysAllocString to pass BSTR to a COM method or FormatMessage to get a description of a Win32 error, the memory manager is out of the game. As a result you have different types of memory: allocated by standard Delphi functions like GetMem, and allocated by the system. The memory manager just can’t report about leaks made by system functions like HeapAlloc or SysAllocString. FastMM is not an exception.
Deleaker finds all kinds of memory leaks.
Run RAD Studio, choose File – New – Console Application – Delphi. Save project as FastMMTests. To enable in-built memory leaks reporting, open FastMMTests.dpr and add set ReportMemoryLeaksOnShutdown to True as shown below:
uses
  System.SysUtils, System.Classes;

begin
  try
    ReportMemoryLeaksOnShutdown := True;
  except
    on E: Exception do
      Writeln(E.ClassName, ': ', E.Message);
  end;
end.
To ensure that in-built memory leaks reporting works well, allocate an instance of TList:
uses
  System.SysUtils, System.Classes;

begin
  System.ReportMemoryLeaksOnShutdown := True;

  try
    TList.Create;
  except
    on E: Exception do
      Writeln(E.ClassName, ': ', E.Message);
  end;
end.
Build it and run. After running it from the IDE, you will not see anything regarding the leak. FastMM dumps the report of leaks to stderr, so you need to run the application from the command line:
Unexpected Memory Leak
An unexpected memory leak has occurred. The unexpected small block leaks are:

13 - 20 bytes: TList x 1
Great! The leak has been found.
Let’s check how Deleaker finds the same leak. Download Deleaker from the downloading page and install it. The setup installs the standalone version of Deleaker and integrates it with RAD Studio versions available on the machine.
Enable Deleaker in RAD Studio, start debugging and look at the Deleaker’s report:
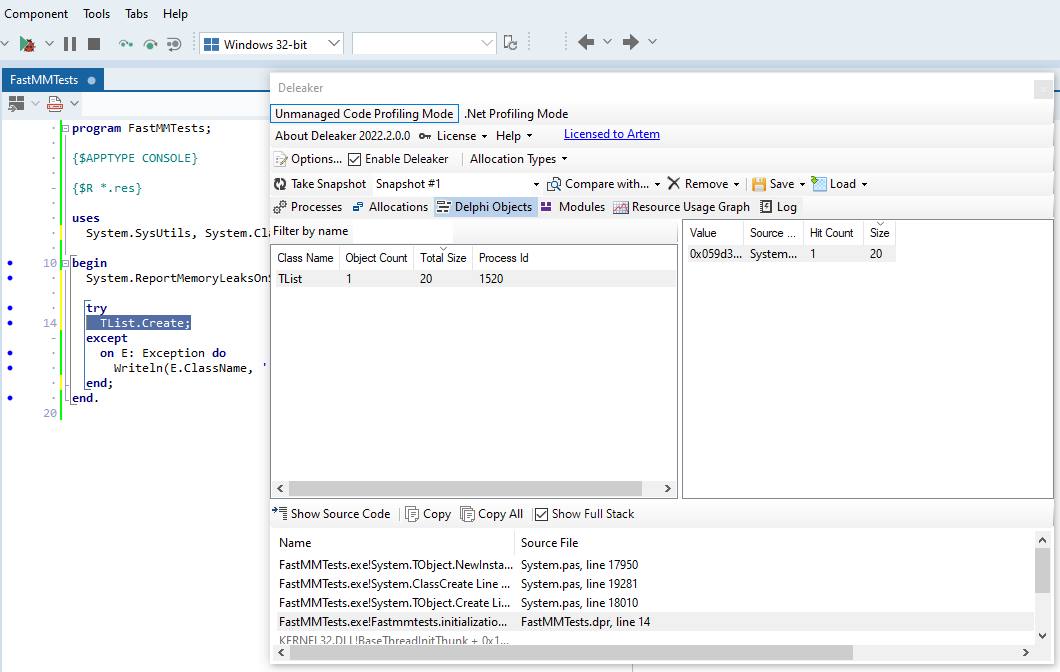
Deleaker has found the leak of TList as well. You can see a call stack (size and value) recorded when the instance was allocated.
To illustrate that FastMM doesn’t find leaks of memory allocated by Windows functions, modify the code as shown below:
uses
  System.SysUtils,
  System.Classes,
  WinApi.ActiveX;

begin
  System.ReportMemoryLeaksOnShutdown := True;

  try
    TList.Create;
    SysAllocString('test');
  except
    on E: Exception do
      Writeln(E.ClassName, ': ', E.Message);
  end;
end.
Rebuild the project and run from the command line. FastMM still reports about one instance of TList.
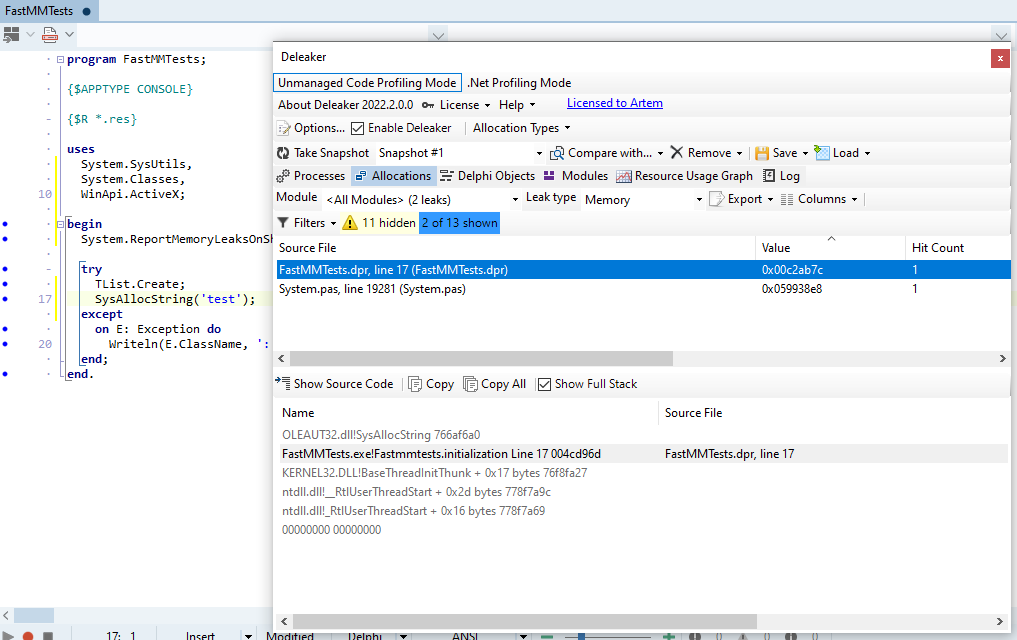
Start debugging in the IDE with Deleaker enabled. Well, Deleaker shows the leak of memory allocated by SysAllocString:
FastMM never reports about GDI and handles leaks.
Till now we’ve been talking about memory, but there are other sources of leaks: GDI and USER objects and handles. These leaks can also be risky because, unlike memory ones, the limits of these resource types are pretty low; therefore they can be exhausted very quickly. FastMM doesn’t deal with handles or GDI and never reports those leaks.
Deleaker finds memory leaks, GDI, User and handles leaks.
Let’s modify the sample; introduce a leak of device contexts (HDC) and a bitmap (HBITMAP):
uses
  System.SysUtils,
  System.Classes,
  WinApi.Windows;

var
  DisplayDC, MemoryDC: HDC;
  MemoryBitmap: HBITMAP;

begin
  System.ReportMemoryLeaksOnShutdown := True;

  try
    DisplayDC := CreateDC('DISPLAY', nil, nil, nil);
    MemoryDC := CreateCompatibleDC(DisplayDC);
    MemoryBitmap := CreateCompatibleBitmap(MemoryDC, 16, 16);
  except
    on E: Exception do
      Writeln(E.ClassName, ': ', E.Message);
  end;
end.
Build and run the application from the command line. FastMM reports nothing!
Start debugging and allow Deleaker to take the final snapshot:
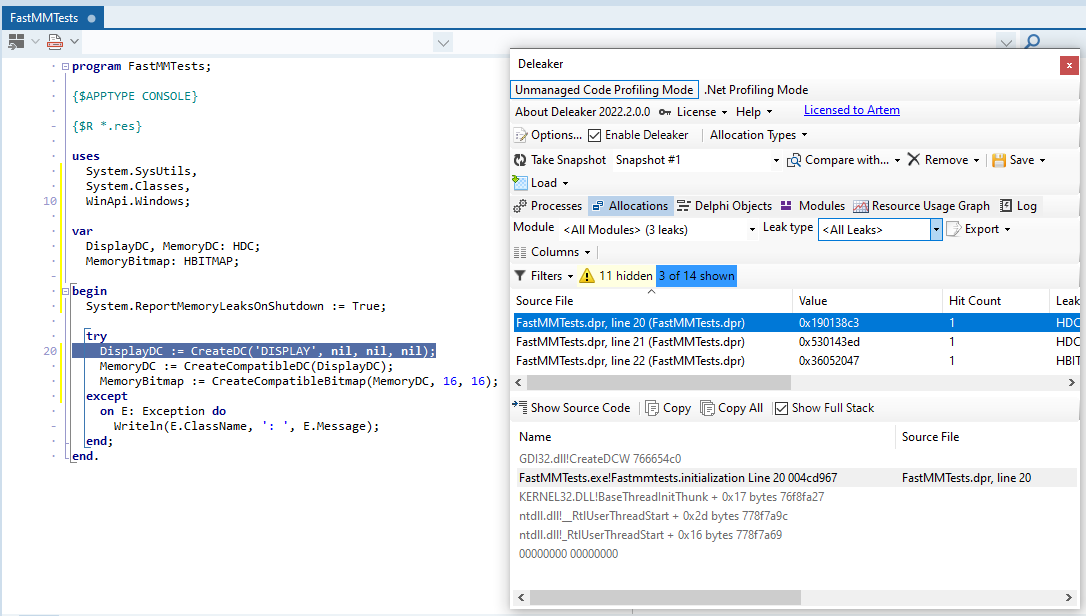
Deleaker finds three GDI leaks as expected!
FastMM doesn’t have a UI.
FastMM is a memory manager; but not a memory profiler. FastMM doesn’t have any user interface where developers can walk through allocated resources, review stack traces, and navigate source code. You can set up FastMM to dump leaks to a file or to show a report on application exit, but it will be just a piece of text. If you have one or two leaks, it may work, but working with such a report is not handy if you suddenly got a thousand leaks.
Deleaker has a friendly UI.
With Deleaker UI, you can filter and sort leaks by their types, sizes, and locations. You can save snapshots for analyzing leaks later or for sharing with colleagues. You can compare snapshots to find and fix permanent leakage:
Deleaker groups allocated objects by their types. You can quickly find objects by typing a type name. For each object, you can review the complete call stack:
Deleaker visually displays application resource usage of memory and GDI objects:
FastMM doesn’t know about snapshots.
A snapshot is a list of allocations with comprehensive information about each one, including size and stack trace. Snapshots are handy when an application seems to gather more and more memory over time. You just compare two snapshots to locate the exact source file name and line number in a program that permanently allocates resources. FastMM can just list allocations, so you have to compare two reports (in plain text!) yourself.
FastMM doesn’t know about allocations made by the 3rd party code.
Imagine that FastMM reports your application has no leaks. At the same time, Task Manager shows that memory usage is growing, and finally, the process crashes. The FastMM power extends only to your application code that calls standard functions like GetMem, but it can’t catch allocations made by 3rd party DLLs loaded to a process. There are a lot of cases: it can be a database driver written in C, a custom build of FFmpeg library, or an ActiveX written in a .NET language.
Conclusion
While FastMM capabilities to catch leaks are very limited, Deleaker provides a way to profile leaks professionally. Being integrated with RAD Studio, Deleaker becomes a part of the standard debugging process. You can break at a line and watch some variables. With Deleaker, you can also take a snapshot and review allocated resources: memory, GDI, User objects, and handles.
Deleaker monitors not only allocations made by FastMM, but literally all of them. It is no matter whether your code allocated memory or a 3rd party DLL, Deleaker catches it.
Deleaker supports 32-bit and 64-bit code and works with Delphi and C++ Builder.