- What is memory profiler?
- Memory leaks patterns in Delphi
- How to use a memory profiler?
- The benifits of a memory profiler
What is memory profiler?
Memory profiler is a type of software tool used in computer programming and software development to analyze and monitor the memory usage of an application. It helps to identify memory leaks, inefficient memory allocation, and excessive memory usage, which can lead to performance issues and crashes in an application. Memory profilers provide insights into the memory allocation and deallocation patterns, allowing developers to optimize memory usage, improve application performance, and identify any memory-related bugs or issues.
Memory profiler is important for Delphi developers for several reasons:
- Memory leaks detection: Delphi applications can suffer from memory leaks, where memory allocated during runtime is not properly deallocated. Memory profiler helps developers identify and locate these leaks, allowing them to fix the issue and prevent memory leaks.
- Optimization of memory usage: Delphi applications sometimes use more memory than necessary due to inefficient memory allocation or excessive memory consumption. Memory profiler enables developers to analyze and optimize memory usage, leading to improved performance and reduced memory footprint.
- Performance optimization: Excessive memory usage can impact the performance of Delphi applications, causing slowdowns and lags. By using a memory profiler, developers can identify parts of the code that consume a large amount of memory and optimize them for better performance.
- Debugging and bug detection: Memory profiler helps in identifying memory-related bugs and issues in Delphi applications. It allows developers to trace memory allocation and deallocation patterns, helping to pinpoint the root cause of bugs and enabling faster debugging.
Overall, memory profiler is an essential tool for Delphi developers to ensure efficient memory management, optimize performance, and enhance the stability of their applications.
Memory leaks patterns in Delphi
In Delphi, memory leaks typically occur when memory is allocated dynamically using the New or GetMem functions, but not properly deallocated using Dispose or FreeMem functions. Here are some common memory leaks patterns in Delphi.
Failure to deallocate memory in a loop
procedure ExampleLeak;
var
  i: Integer;
  ptr: PInteger;
begin
  for i := 0 to 10 do
  begin
    New(ptr);
    // Perform some operations with ptr
  end;
end;
In this example, memory is allocated in each iteration of the loop using New, but it is not deallocated. This leads to a memory leak where each allocated ptr is not freed.
Failure to deallocate objects
procedure ExampleLeak;
var
  obj: TObject;
begin
  obj := TObject.Create;
  // Perform some operations with obj

  // Missing obj.Free; or obj.DisposeOf; here
end;
In this example, an object is created using the constructor, but it is not freed using the Free or DisposeOf methods. This results in a memory leak where the memory allocated for the object is not released.
Circular references between objects
type
  TMyObject = class
    OtherObject: TMyObject;
  end;

procedure ExampleLeak;
var
  obj1, obj2: TMyObject;
begin
  obj1 := TMyObject.Create;
  obj2 := TMyObject.Create;

  obj1.OtherObject := obj2;
  obj2.OtherObject := obj1;

  // Missing obj1.Free; or obj2.Free; here
end;
In this example, two TMyObject instances are created, and each object has a reference to the other. If the objects are not properly freed, a memory leak occurs as the objects will not be freed due to the circular reference.
To detect and resolve memory leaks in Delphi, you can use memory profiling tools like Deleaker. These tools provide detailed reports and analysis of memory usage, including identifying specific objects or memory blocks that are not freed and pinpointing the source code location where the memory allocation occurred.
How to use a memory profiler?
To use a memory profiler, follow the steps below.
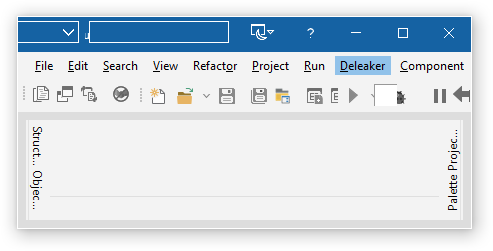
Get and install the memory profiler for RAD Studio using the following link: https://www.deleaker.com/download.html. Once installed, open RAD Studio. You will notice a new menu item called “Deleaker”:
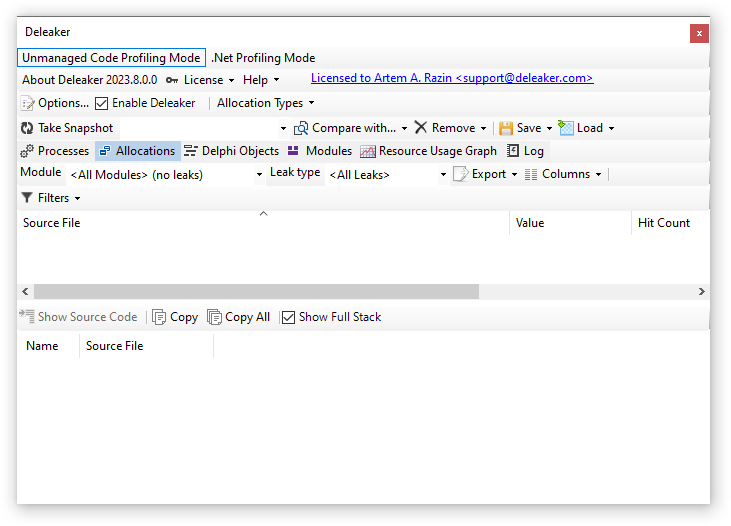
Click on Deleaker and select Deleaker Window to open the profiler window. Initially, the window will be empty:
To demonstrate how Deleaker detects memory leaks, create a new console application and add the following code:
program Project1;

{$APPTYPE CONSOLE}

{$R *.res}

uses
  System.SysUtils;

procedure ExampleLeak1;
var
  i: Integer;
  ptr: PInteger;
begin
  for i := 0 to 10 do
  begin
    New(ptr);
    // Perform some operations with ptr
  end;
end;

procedure ExampleLeak2;
var
  obj: TObject;
begin
  obj := TObject.Create;
  // Perform some operations with obj

  // Missing obj.Free; or obj.DisposeOf; here
end;

type
  TMyObject = class
    OtherObject: TMyObject;
  end;

procedure ExampleLeak3;
var
  obj1, obj2: TMyObject;
begin
  obj1 := TMyObject.Create;
  obj2 := TMyObject.Create;

  obj1.OtherObject := obj2;
  obj2.OtherObject := obj1;

  // Missing obj1.Free; or obj2.Free; here
end;

begin
  try
    ExampleLeak1;
    ExampleLeak2;
    ExampleLeak3;
  except
    on E: Exception do
      Writeln(E.ClassName, ': ', E.Message);
  end;
end.
Start debugging the application. Once the process completes, Deleaker will capture a snapshot that includes all allocated objects and memory blocks that were not freed:
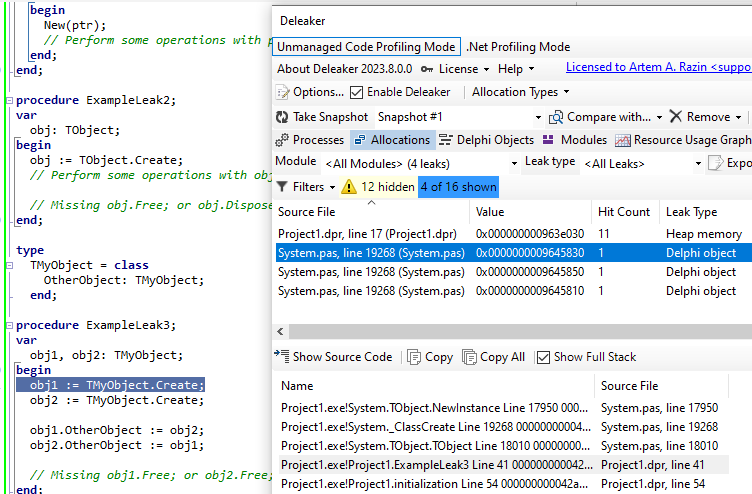
Impressive! Deleaker will identify and display all the memory leaks found. You can review the size of each leak and view the complete stack traces associated with them.
The benifits of a memory profiler
Deleaker is an invaluable and highly beneficial tool specifically designed for RAD Studio developers. It offers a wide range of capabilities aimed at resolving various types of leaks, including memory leaks, GDI leaks, and leaks of handles and USER32 objects. By integrating Deleaker into the RAD Studio environment, developers can effectively and efficiently identify and rectify these leaks, ensuring the stability and robustness of their applications.
One of the significant advantages of Deleaker is its compatibility with both 32-bit and 64-bit applications. This means that developers can confidently utilize Deleaker regardless of the target platform or architecture, allowing for seamless and optimized memory management across a wide range of projects.
In summary, Deleaker serves as an essential and powerful add-on for RAD Studio, empowering developers to detect and address leaks related to memory, GDI resources, and handles or USER32 objects. Its compatibility with both 32-bit and 64-bit applications ensures its versatility and usefulness across various development scenarios.