In this article, you will learn how to identify and resolve memory leaks in your C++ code when using CLang.
- What is CLang?
- Why is it vital to fix memory leaks in C++?
- How to fix memory leaks in CLang?
- Wrap-up
What is CLang?
CLang (pronounced “see-lang”) is a compiler front-end for the C, C++, and Objective-C programming languages. It is the default compiler for most of the Apple platforms, including macOS and iOS. CLang provides many modern features, such as excellent syntax checking, diagnostics, and code optimization. It aims to be a drop-in replacement for the GNU Compiler Collection (GCC) and is known for its fast compilation speed and low memory usage. Additionally, CLang is open-source and widely used by developers across various platforms.
Why is it vital to fix memory leaks in C++?
Memory leaks can occur more easily in C++ due to its manual memory management and the flexibility it provides to programmers.
There are several common mistakes that can lead to memory leaks in C++: forgetting to deallocate memory, failing to release resources in exception handling, not deallocating memory in destructors, overwriting pointers without releasing memory, incorrect ownership transfer, misusing containers or data structures, and circular references.
It is vital to fix memory leaks in C++ to prevent resource depletion, improve program performance, avoid unpredictable behavior, ensure scalability, and mitigate security vulnerabilities.
To avoid memory leaks, it is essential to follow good memory management practices, such as using smart pointers, RAII (Resource Acquisition Is Initialization), and properly deallocating memory using delete or delete[] when it is no longer needed. Regular code reviews, testing, and utilizing debugging tools can help identify and fix memory leaks before they become problematic.
Memory leaks and CLang
CLang, being a compiler, does not directly offer tools or features specifically designed to locate memory leaks in C++. However, CLang can still be valuable in identifying potential memory leaks through its various diagnostic capabilities. Some of the features provided by CLang that can help in locating memory leaks include:
- Static Code Analysis: CLang incorporates static code analysis capabilities that can detect potential memory leaks by analyzing the code for common patterns and programming mistakes. It can issue warnings or suggestions regarding memory allocation and deallocation.
- Memory Sanitizers: CLang provides memory sanitizers, such as the AddressSanitizer (ASan) and UndefinedBehaviorSanitizer (UBSan). These tools can detect memory errors, including leaks, use-after-free, and buffer overflows, by instrumenting the compiled code with additional checks.
- Profiling and Debugging Support: CLang integrates with various profiling and debugging tools, such as LLVM’s built-in profiler (llvm-profdata) and debugger (lldb). These tools can help in identifying memory leaks during runtime by analyzing memory allocations and tracking object lifetimes.
- Integration with Analyzers: CLang can be used in conjunction with external analyzers or static analysis tools, such as clang-tidy or Clang Static Analyzer. These tools can provide additional checks and rules specifically targeted at detecting memory leaks and offering suggestions for fixing them.
While CLang itself may not have dedicated features for pinpointing memory leaks, it can be a valuable tool in a broader toolchain that includes analyzers, sanitizers, and profiling/debugging utilities. Leveraging these features can aid in locating and addressing memory leaks effectively in C++ programs.
If you find that these tools do not help, you may consider using a dedicated memory profiler like Deleaker, which supports a wide range of compilers, including CLang.
How to fix memory leaks in CLang?
To demonstrate how to detect and fix memory leaks in CLang, let’s create a simple console application with an intentional leak and build it using CLang.
There are various ways to do this, but for this tutorial, we will use Visual Studio 2022. You might need to install the “C++ Clang compiler for Windows” through the Visual Studio installer.
Launch Visual Studio and create a new CMake project named “LeaksTest”.
Next, open CMakePresets.json and make the necessary modifications to use the CLang compiler instead of the default one:
{
    "version": 3,
    "configurePresets": [
        {
            "name": "windows-base",
            "hidden": true,
            "generator": "Ninja",
            "binaryDir": "${sourceDir}/out/build/${presetName}",
            "installDir": "${sourceDir}/out/install/${presetName}",
          "cacheVariables": {
            "CMAKE_C_COMPILER": "clang-cl.exe",
            "CMAKE_CXX_COMPILER": "clang-cl.exe"
Open the LeaksTest.cpp file and add the following memory leak:
int main()
{
	new int;
	cout << "Hello CMake." << endl;
	return 0;
}
Build the project.
Now it is time to install the memory profiler for CLang. You can download it from: https://www.deleaker.com/download.html
Once installed, you can use the profiler either as a standalone application or directly from Visual Studio.
Launch Deleaker and select the executable that was just built. Click on “Start Debugging” and allow the process to finish, letting Deleaker create a snapshot:
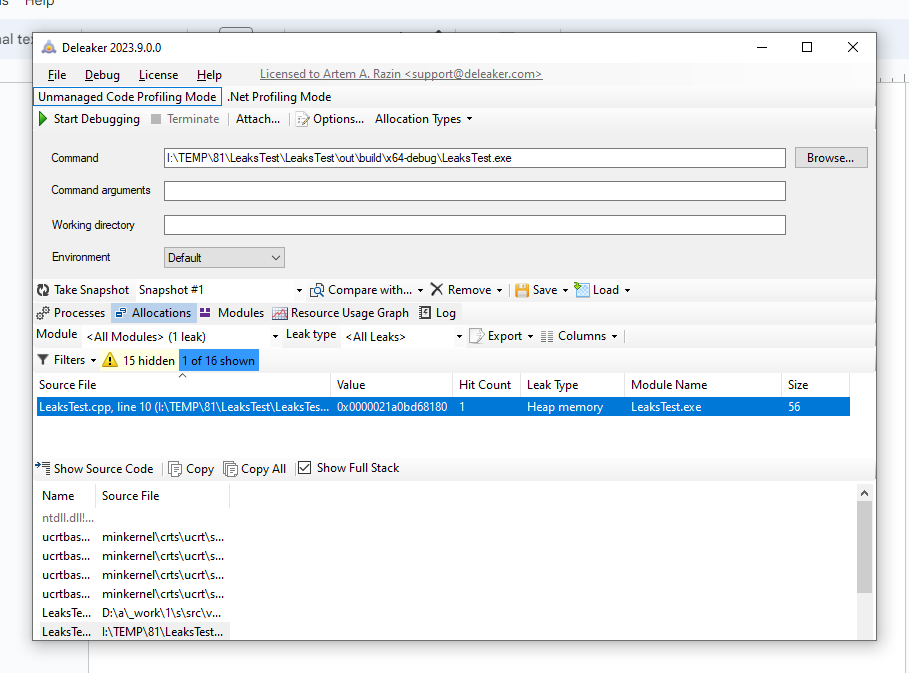
Great! Deleaker has detected the memory leak that we intentionally added. You can review the call stack and check other characteristics such as the size of the leak.
Wrap-up
If you are using CLang, there are various tools available, such as static analyzers and memory sanitizers, that can help detect memory leaks. Additionally, utilizing a memory profiler with a user-friendly interface, like Deleaker, is highly recommended. With Deleaker, you can capture snapshots while your application is running or after it has completed. These snapshots can then be compared to identify any persistent memory leaks. Moreover, Deleaker can be seamlessly integrated with popular C++ IDEs such as Visual Studio or QT Creator, allowing you to address memory leaks without leaving your preferred development environment.