In this guide, you will learn how to detect leaks in an ISAPI extension developed in Delphi. By using a sample ISAPI extension as an example, we will demonstrate how to utilize a memory profiler in conjunction with the Delphi debugger to pinpoint leaks effectively within RAD Studio.
Contents
What is ISAPI?
ISAPI, or Internet Server Application Programming Interface, is a technology that allows developers to create extensions and filters that enhance the functionality of web servers. These extensions enable servers to handle requests dynamically, improving performance compared to traditional CGI programs. ISAPI is primarily used with Microsoft’s IIS (Internet Information Services).
ISAPI extensions are implemented as DLLs and can be written using Delphi.
Setup IIS
First, you need to install Internet Information Services (IIS). To do this, open the Control Panel, click on “Programs”, and then select “Turn Windows features on or off” under “Programs and Features”. Next, choose “Internet Information Services” as illustrated below:
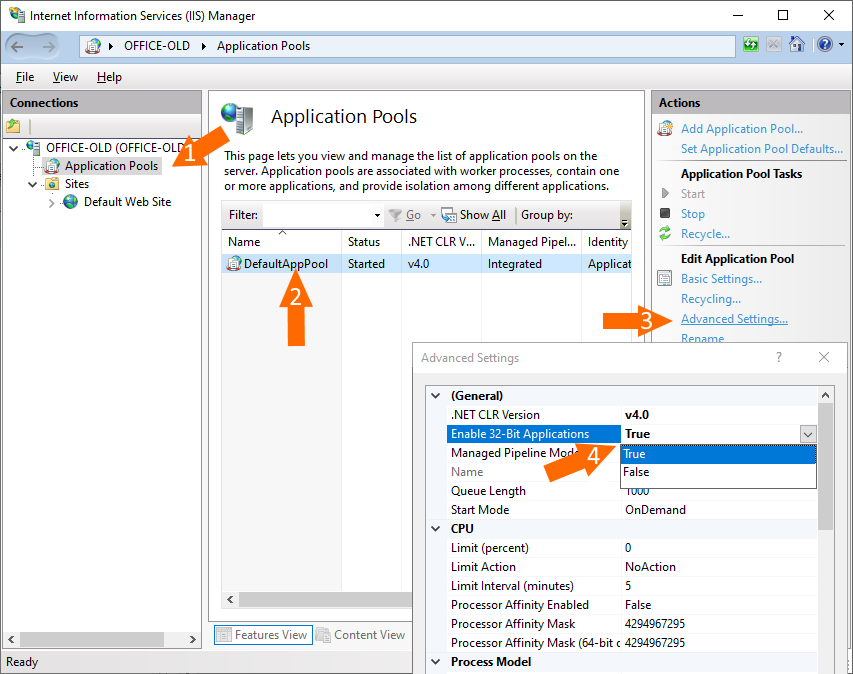
Allow Windows to download and install the required software. Once installation is complete, you need to enable several options. Run “Internet Information Services (IIS) Manager” from the Start menu, expand the root node on the left, select “Application Pools”, then choose “DefaultAppPool”. Click on “Advanced Settings” and set “Enable 32-Bit Applications” to “True”:
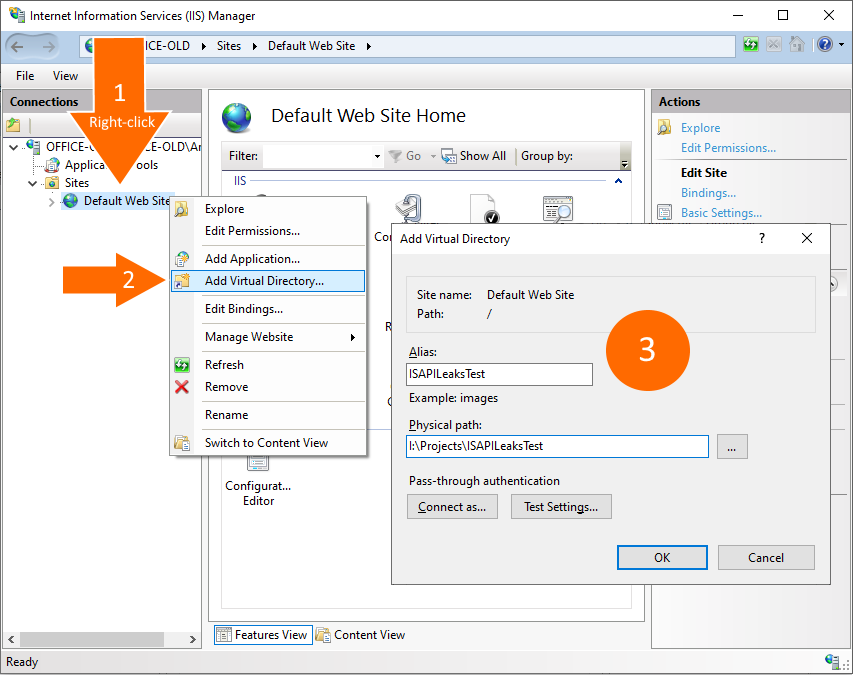
Create a directory where the ISAPI extension DLL will be placed later. Then add it as a virtual directory. To do this, right-click on “Default Web Site” and select “Add Virtual Directory…”:
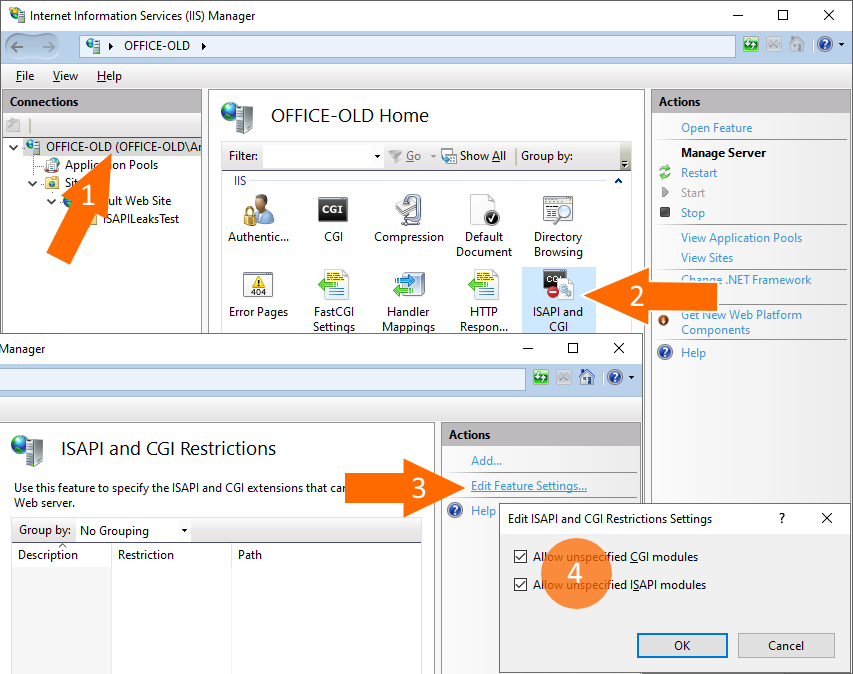
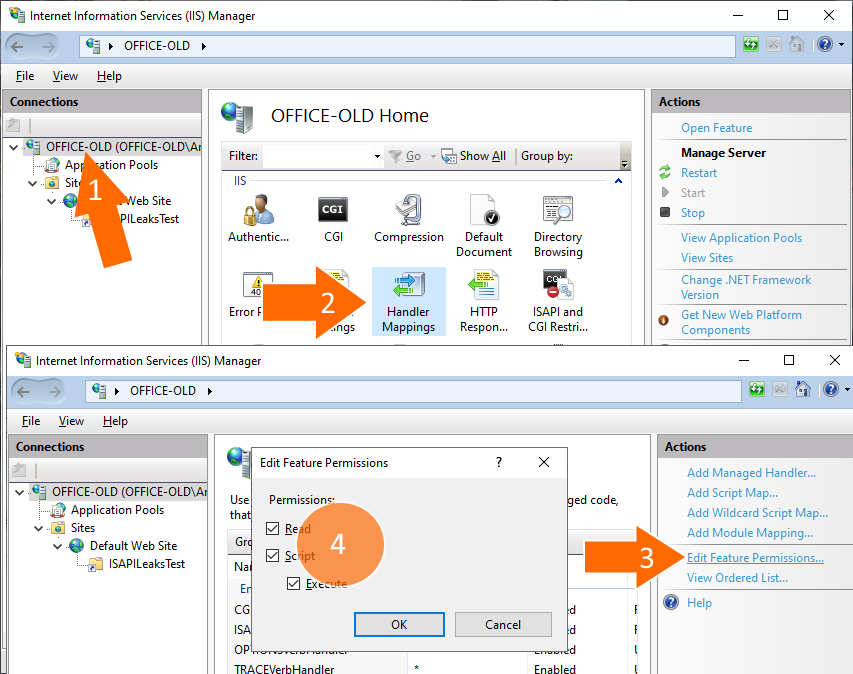
After that, you need to enable unspecified CGI and ISAPI modules:
Next, enable execute permissions: click the root node, then double-click “Handler Mappings”. Click “Edit Feature Permissions…” and select “Read”, “Script”, and “Execute”:
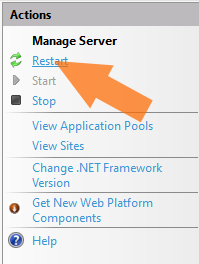
Finally, restart the server:
Great! The server setup is complete, and now we can create a project that will display the current time.
Create a Project
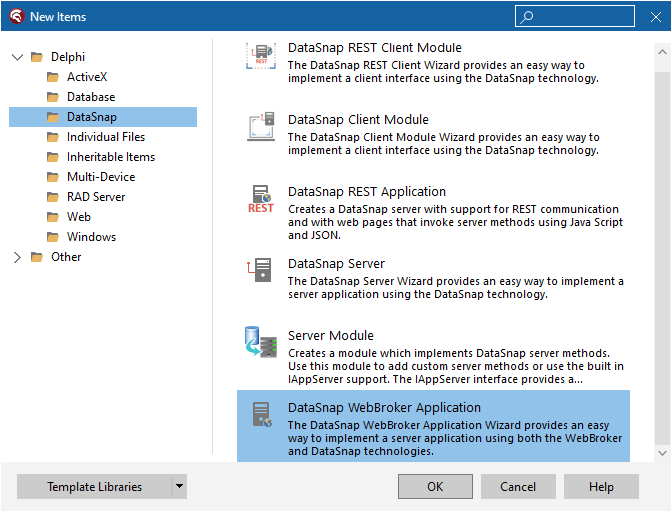
Launch RAD Studio. Click “File” in the main menu, then choose “New” and select “Other”. In the “New Items” dialog, click “DataSnap”, and double-click “DataSnap WebBroker Application”:
Navigate to “WebModuleUnit1.pas”, add the IdSNTP unit, and modify TWebModule1.WebModule1DefaultHandlerAction to output the current time, as shown below:
uses
  System.SysUtils, System.Classes, Web.HTTPApp,
  IdSNTP;

// ...

procedure TWebModule1.WebModule1DefaultHandlerAction(Sender: TObject;
  Request: TWebRequest; Response: TWebResponse; var Handled: Boolean);
var
  IdSNTP: TIdSNTP;
begin
  IdSNTP := TIdSNTP.Create(nil);
  IdSNTP.Host := 'time.windows.com';

  Response.Content :=
    '<html>' +
    '<head><title>Web Server Application</title></head>' +
    '<body>Current time is:' + DateTimeToStr(IdSNTP.DateTime) + '</body>' +
    '</html>';
end;
Right-click on “Project1.dll”, choose “Options”, select “Delphi Compiler”, and set the “Output directory” to “I:\Projects\ISAPILeaksTest”, the directory we previously used for the virtual directory. Then, rebuild the project.
To check how it is working, open a web browser and navigate to http://localhost/ISAPILeaksTest/Project1.dll. Refresh the page several times to verify that the displayed time updates with each refresh.
If you open the Task Manager, you may notice that the memory usage of w3wp.exe (the process that IIS uses to handle web client requests and which has loaded our ISAPI DLL) increases over time as you continue to refresh the web page:
How to Fix Leaks?
It’s time to profile w3wp.exe. Technically, we aim to profile the ISAPI DLL, but in fact, you can only profile a process, not the DLL itself. It’s also important to ensure that your project is built with debug information. Click Project – Options, then set Compiling – Debug information to “True”, and Linking – Debug information to “True”.
In order to profile w3wp.exe, you need to install a plugin for RAD Studio that enhances its debugger by enabling it to identify leaks. You can download it from the following link: https://www.deleaker.com/download.html.
After installing Deleaker, you can access it by finding the ‘Deleaker’ menu item in the main menu.
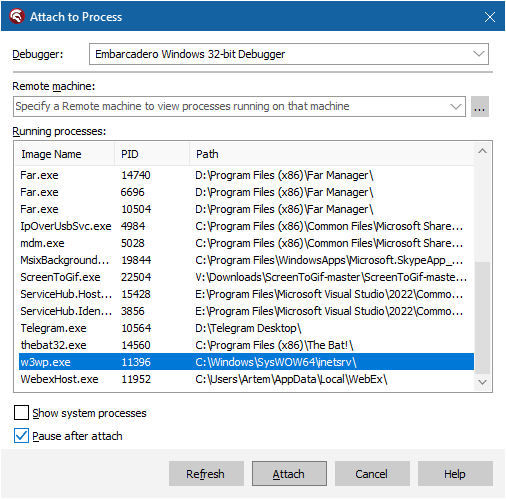
Since we are going to debug the process w3wp.exe, which is running under the “DefaultAppPool” user, you need to restart RAD Studio with administrative rights. After restarting, click “Run”, then “Attach to Process”, and select w3wp.exe:
Additionally, you need to ensure that the DeleakerDbgSrv service is running. You can check this by running “services.msc”. This service assists Deleaker in profiling Windows services.
After clicking “Attach”, the debugger will pause the execution; simply continue it after that.
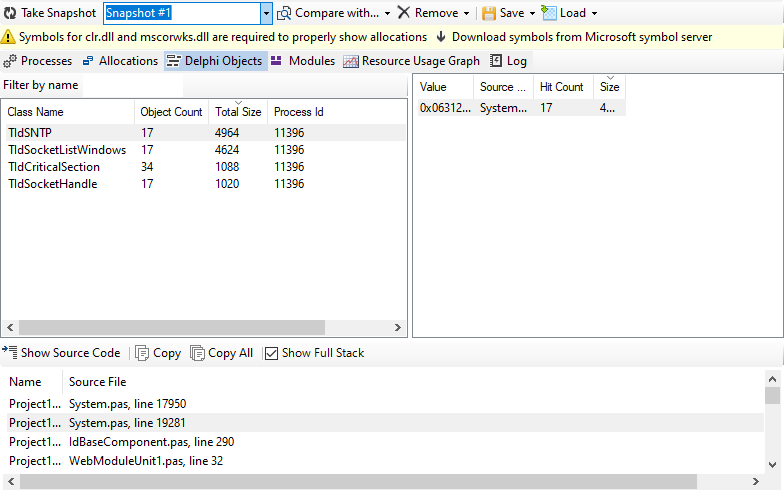
Return to the web browser and refresh the web page several times. Then, go back to RAD Studio, click “Deleaker” then “Deleaker Windows”, and click “Take Snapshot”. Now you have a base snapshot, which can provide some insights into potential leaks:
Since we observe that memory usage is increasing, it’s a good idea to reproduce this by refreshing the web page several more times. After doing so, take another snapshot, click “Compare with”, and select the base snapshot. Now you can see the new allocations, i.e., those that were made after the base snapshot was taken:
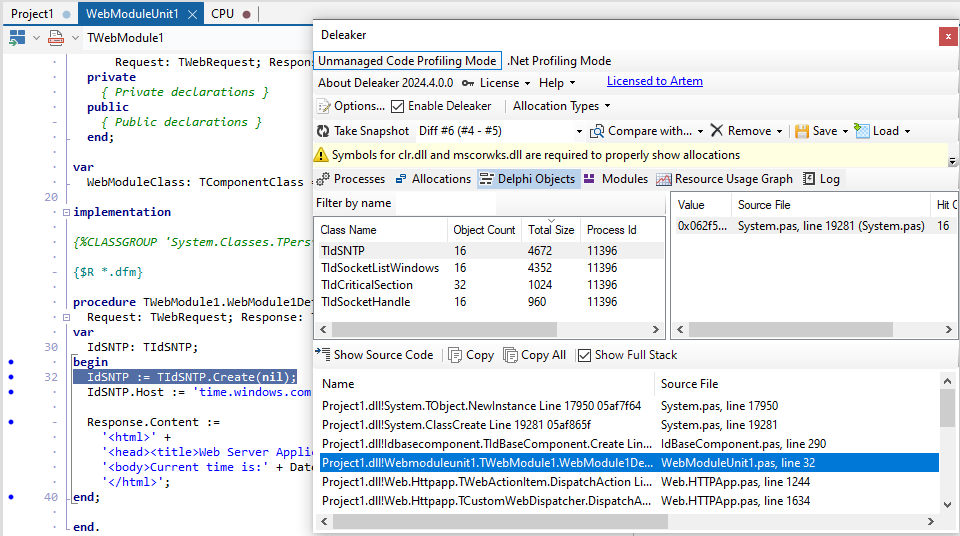
As you can see there are leaked instances of TIdSNTP which indeed were allocated but never freed!
Wrap-up
Profiling Windows services has always been a challenge, but using a memory profiler greatly simplifies this task. In conjunction with the standard Delphi debugger, Deleaker extends its functionality by gathering information about allocated resources, including memory, Delphi objects, GDI and USER objects, and handles. For each resource, you can view details such as size, hit count, and, most importantly, a call stack that directs you to the location in your code where this resource was allocated.