How to fix leaks of handles?
Contents
- What are the handle leaks?
- Is there a limit to a maximum number of handles?
- How to check if a process has handle leaks?
- Bonus: How to enumerate handles programmatically?
- How to find handle leaks?
- Conclusion
What are the handle leaks?
Applications don’t have direct access to Windows resources (for example, a file); instead, Windows API provides functions that create or open some of them. Such function returns a handle. Handle is a value that identifies a resource. Windows API also has functions that manipulate resources (for example, reading from a file) by passing a handle to them.
Handle leaks occur when a process gets more and more handles but doesn’t close them. For some types of resources, their handles must be closed by CloseHandle.
CloseHandle closes handles of the following resources: mutexes, events, semaphores, jobs, processes, threads, timers, pipes, I/O completion ports, mailslots, file, file mappings, access tokens, communications devices, console inputs, console screen buffers, and memory resource notifications. For the rest resources, please look at the following table:
| Change notification | FindCloseChangeNotification |
| Event log | CloseEventLog |
| Find file | FindClose |
| Socket | closesocket |
| Update resource | EndUpdateResource |
It is essential to use the correct function with the relevant kinds of resources.
A compiler produces no warning if you pass an event log handle to CloseHandle or not. However, it sometimes leads to leaks of handles.
Is there a limit to a maximum number of handles?
Of course, everything has its limits. The question is whether it depends on how much memory is available for a process or for entire system. A process is unable to allocate more than 65536 GDI objects. What about handles? To respond to this question, we have created a small application that opens a handle of the current process and then duplicates the handle until the system returns an error.
You can find the complete source code of the project on GitHub: https://github.com/Softanics/WinHandlesLimits
We use the following code:
auto const h = OpenProcess(PROCESS_ALL_ACCESS, FALSE, GetCurrentProcessId());

for (auto handleCount = 0; ; handleCount++)
{
    HANDLE dup;

    if (!DuplicateHandle(
        GetCurrentProcess(),
        h,
        GetCurrentProcess(),
        &dup,
        0,
        FALSE,
        DUPLICATE_SAME_ACCESS))
    {
        std::cout << "Total handles: " << handleCount << std::endl;
        return -1;
    }
}
The 32-bit build displays:
Total handles: 16711509
The 64-bit build displays:
Total handles: 16711562
These numbers give an idea of the limits.
How to check if a process has handle leaks?
You can use Task Manager to review the handle count of a process. If Task Manager doesn’t show handles count, you need to right-click the header, select Select Columns and choose Handles:
Unfortunately, there is no information about handle types, which could help understand where the leaks are. How to get a handle types list for a particular process? There is a utility called Handle by Mark Russinovich. The command-line tool displays information for the entire system or some process. Use the following command to list handles:
handle64.exe -p 29532 -a
29532 is a process id.
Look at the typical output:
V:\Downloads\Handle>handle64.exe -p 29532 -a

Nthandle v4.21 - Handle viewer
Copyright (C) 1997-2018 Mark Russinovich
Sysinternals - www.sysinternals.com

    4: Event
    8: Key           HKLM\SOFTWARE\Microsoft\Windows NT\CurrentVersion\Image File Execution Options
    C: Event
   10: WaitCompletionPacket
   14: IoCompletion
   18: TpWorkerFactory
   1C: IRTimer
   20: WaitCompletionPacket
   24: IRTimer
   28: WaitCompletionPacket
   2C: EtwRegistration
   30: EtwRegistration
   34: EtwRegistration
   38: Directory     \KnownDlls
It is excellent to know handle types, but knowing the location a process created them is much better. Standard tools can’t help: that is why you need a profiler.
Bonus: How to enumerate handles programmatically?
The following method is helpful for those who want to add handle count monitoring to their applications. You can compare handle count before and after some code to ensure the absence of handle leak. In case of leaks, just dump allocated handles with their types.
A process itself can enumerate handles with their types. Use ntdll.dll!NtQuerySystemInformation with SystemHandleInformation (0x10) to enumerate all opened handles in the system; it fills SYSTEM_HANDLE_TABLE_ENTRY_INFO for each handle. Compare SYSTEM_HANDLE_TABLE_ENTRY_INFO::ProcessId with the current process id. To get a handle type, call ntdll.dll!NtQueryObject with ObjectInformationClass (2). The type is returned as a string.
You can find the complete source code on GitHub:
https://github.com/Softanics/EnumWinHandles
Unfortunately, this approach doesn’t return call stacks, so you may have no idea where a particular handle has been allocated in your program. Again, you need a profiler.
How to find handle leaks?
Deleaker is a profiler that finds memory leaks, leaks of GDI and USER32 objects, and leaks of handles. Deleaker can work as a standalone application; also, it integrates with powerful IDEs, including Visual Studio, Qt Creator, and RAD Studio.
You can get Deleaker at the downloading page. Run the installer, enable integration with Visual Studio. After installation, run Visual Studio and ensure that Deleaker is enabled:
Let’s profile an application that starts a process using CreateProcess:
#include <windows.h>

int main()
{
    STARTUPINFOW startupInfo{};
    PROCESS_INFORMATION processInfo{};

    CreateProcessW(
        L"C:\\Windows\\System32\\notepad.exe",
        nullptr,
        nullptr,
        nullptr,
        FALSE,
        0,
        nullptr,
        nullptr,
        &startupInfo,
        &processInfo);
}
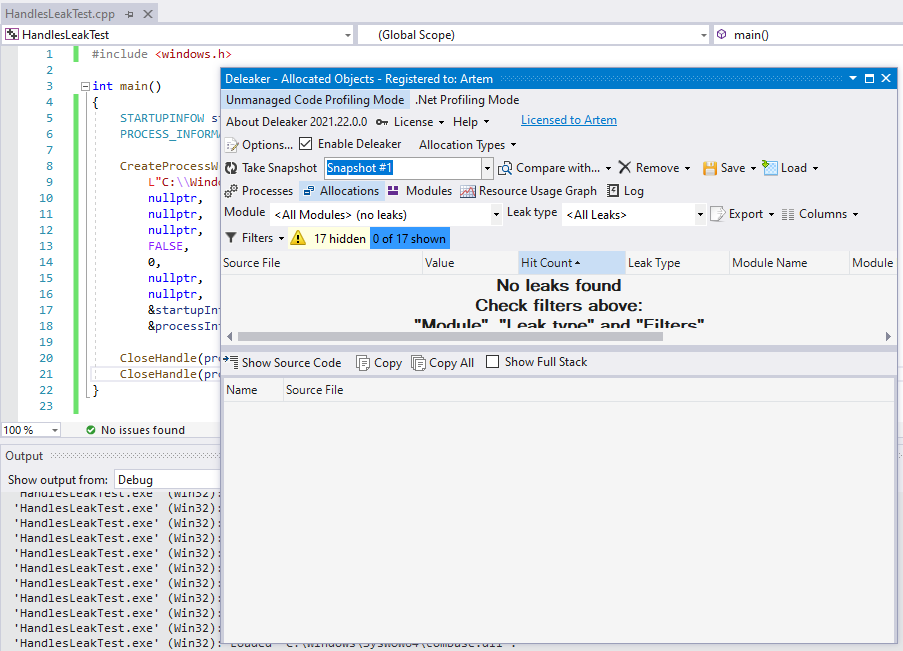
Start debugging and wait until the program exits. Deleaker takes a snapshot and displays leaks:
Deleaker has detected leaks of two handles: a process handle and a thread handle. Indeed, a caller must close handles returned in the structure PROCESS_INFORMATION, whose address is passed to the CreateProcess.
#include <windows.h>

int main()
{
    STARTUPINFOW startupInfo{};
    PROCESS_INFORMATION processInfo{};

    CreateProcessW(
        L"C:\\Windows\\System32\\notepad.exe",
        nullptr,
        nullptr,
        nullptr,
        FALSE,
        0,
        nullptr,
        nullptr,
        &startupInfo,
        &processInfo);

    CloseHandle(processInfo.hProcess);
    CloseHandle(processInfo.hThread);
}
Let’s close the handles and try again:
Great! Leaks have been fixed!
Conclusion
Leaks of handles may decrease the performance of your application and the system. Similar to other system resources, those handles that a process doesn’t need anymore should be closed immediately. Tools like Task Manager can show the handle count, but it doesn’t provide information about handle types and where a process has allocated them. Windows API provides a way to enumerate all handles and get their types but doesn’t return call stacks. To get detailed information about live handles, you need a profiler. Deleaker provides complete information for each handle: a type and a call stack. This information helps detect leaked handles and fix the issue.