User Objects Leaks detection tool.
Leaks of User Objects can be hazardous. It is not easy to find using standard tools. This guide will show how to locate leaked objects and fix leaks.
Contents
- What are User objects in Windows?
- How to check if User objects are leaking?
- Is there a limit of User objects?
- How to avoid User object leaks?
- How to monitor User objects?
- How to fix User objects leaks?
- Conclusion
What are User objects in Windows?
Windows API provides several resources: memory, handles, GDI objects, and User objects. User objects are accelerator tables, carets, icons, cursors, DDE conversations, hooks, menus, windows, and window positions. Almost any Windows application, directly or indirectly, creates user objects: when a window is shown, an appropriate HWND is allocated. If you see a menu or press a key combination, the process has already allocated HMENU and HACCEL. A resource hasn’t been freed, although it is not required anymore; this results in leaks, but how do you realize if a process is leaking?
How to check if User objects are leaking?
The easiest way is to open Task Manager and look at the user objects count. If you don’t see the column, right-click the header, choose Select Columns and tick User objects:
A developer may suspect leaks in his application if it works unstable, crashes or windows are drawn incorrectly.
Is there a limit of User objects?
Like GDI objects, user objects, available for a process, also have strict limitations. The maximum number can’t be more than 65536, but in practice it is lower. It is worth mentioning, you can set the limit using the following registry key: HKEY_LOCAL_MACHINE\SOFTWARE\Microsoft\Windows NT\CurrentVersion\Windows\USERProcessHandleQuota, but if you see a value of more than 18000, it will not work.
How to avoid User object leaks?
The corresponding function must release each user object’s type. Using incorrect functions leads to leaks.
Try not to allocate a lot of user objects at the same time. Release objects when they are not required.
In C++, it is a good idea to use wrappers (based on std::shared_ptr or std::unique_ptr); in .NET, use the dispose pattern to automatically free resources.
How to monitor User objects?
Neither Visual Studio nor other IDEs provide a built-in profiler to track user objects. That is why you need to extend Visual Studio by Deleaker that adds a profiler to the IDE, helping developers locate memory leaks, GDI object handles, and user objects.
Deleaker can work in standalone mode, which is helpful for profiling an application on a client’s machine without having an IDE installed.
Let’s look at Deleaker in action!
How to fix User objects leaks?
You can download Deleaker at the downloading page. The installer allows to select IDEs to install, including Visual Studio, RAD Studio, and Qt Creator:
The sample application will have the following leak:
#include <windows.h>

int main()
{
    auto const screenDC = CreateDCW(L"DISPLAY", nullptr, nullptr, nullptr);
    auto const memDC = CreateCompatibleDC(screenDC);
    auto const memBmp = CreateCompatibleBitmap(screenDC, 16, 16);
    auto const oldBmp = SelectObject(memDC, memBmp);

    auto const brush = CreateSolidBrush(RGB(0xff, 0, 0));

    RECT rc{ 0, 0, 16, 16 };
    FillRect(memDC, &rc, brush);

    DeleteObject(brush);

    ICONINFO iconInfo{};

    iconInfo.fIcon = TRUE;
    iconInfo.hbmMask = memBmp;
    iconInfo.hbmColor = memBmp;

    auto const icon = CreateIconIndirect(&iconInfo);

    SelectObject(memDC, oldBmp);
    DeleteObject(memBmp);
    DeleteDC(memDC);
    DeleteDC(screenDC);
}
Ensure that Deleaker is enabled in Visual Studio. Click to Extensions – Deleaker – Enable Deleaker to enable it:
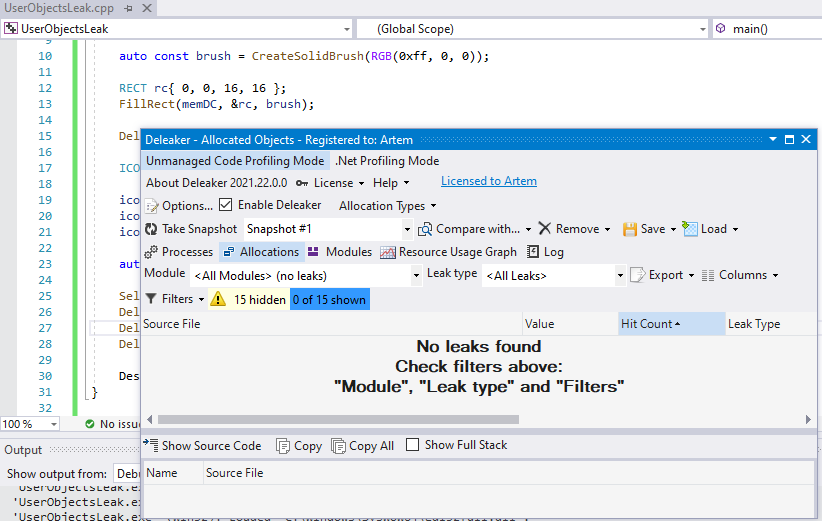
Start debugging allows the application to do the job. When it exits, Deleaker starts taking a snapshot. As expected, it contains a leak of an icon handle return by CreateIconIndirect:
![]()
To fix the leak, you need to call DestroyIcon:
#include <windows.h>

int main()
{
    auto const screenDC = CreateDCW(L"DISPLAY", nullptr, nullptr, nullptr);
    auto const memDC = CreateCompatibleDC(screenDC);
    auto const memBmp = CreateCompatibleBitmap(screenDC, 16, 16);
    auto const oldBmp = SelectObject(memDC, memBmp);

    auto const brush = CreateSolidBrush(RGB(0xff, 0, 0));

    RECT rc{ 0, 0, 16, 16 };
    FillRect(memDC, &rc, brush);

    DeleteObject(brush);

    ICONINFO iconInfo{};

    iconInfo.fIcon = TRUE;
    iconInfo.hbmMask = memBmp;
    iconInfo.hbmColor = memBmp;

    auto const icon = CreateIconIndirect(&iconInfo);

    SelectObject(memDC, oldBmp);
    DeleteObject(memBmp);
    DeleteDC(memDC);
    DeleteDC(screenDC);

    DestroyIcon(icon);
}
Rebuild the project and rerun it. This time we don’t have leaks:
Conclusion
It is vital for developers to fix leaks quickly because they can make any process or even the entire system unstable. Unfortunately, standard debugging tools can’t help fix leaks of user objects.
Deleaker extends IDE providing comprehensive information about allocated resources, including their types, size, and call stacks.
Deleaker supports 32-bit and 64-bit applications written in C++, Delphi, and .NET.