How to find memory leaks in Delphi?
This tutorial demonstrates the way to detect memory leaks and other resources leaks in applications, written in Delphi.
Deleaker can work either as a standalone application, or as a RAD Studio extension. Deleaker Standalone is convenient, for example, if RAD Studio is not installed.
If Deleaker works as an extension, a developer can search for leaks without leaving RAD Studio, what let him move to the source of possible errors quicker.
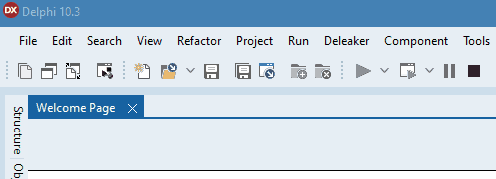
After installation, a new Deleaker item is added to the RAD Studio main menu:
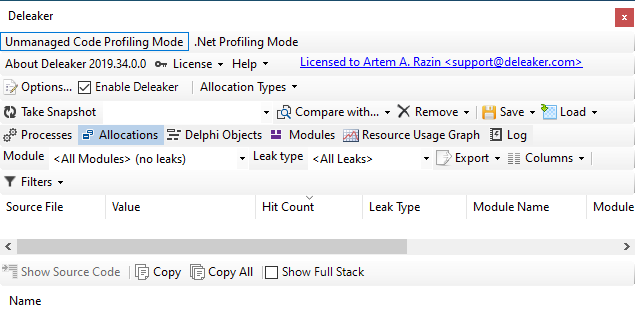
To open the Deleaker window, click on Deleaker - Deleaker Window:
Adding a memory leak
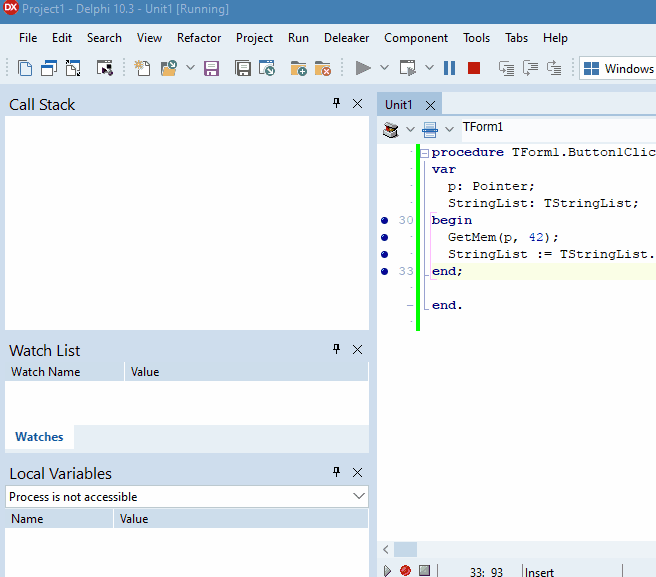
Let's create a simple application with a single form, then add a button, by clicking on it allocate some memory and create an object:
procedure TForm1.Button1Click(Sender: TObject);
var
  p: Pointer;
  StringList: TStringList;
begin
  GetMem(p, 42);
  StringList := TStringList.Create;
end;
Project setup
In order to get the most reliable and complete information about leaks, you need to configure the project options.
Enable debug information
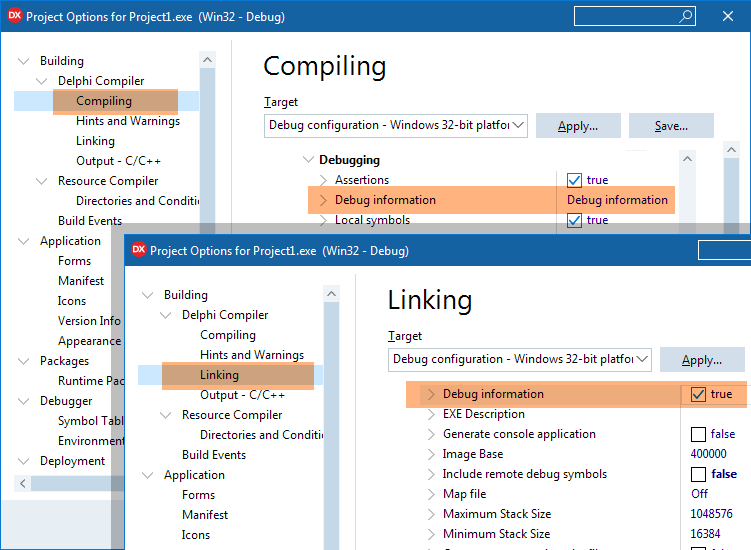
First of all, it is necessary to make the compiler and the linker generate debug information. Using this information, Deleaker can determine the file with the source code, the addresses in call stacks correspond to.
For the compiler: to generate debug information, click on Project - Project Options, go to Building - Delphi Compiler - Compiling and set Code generation - Debug information to Debug information.
For the linker: to generate debug information, click on Project - Project Options, go to Building - Delphi Compiler - Linking and set Debug information to True:
If a project is built using the command line, compiler switch -V is specified to generate debug information.
Stack frames generation
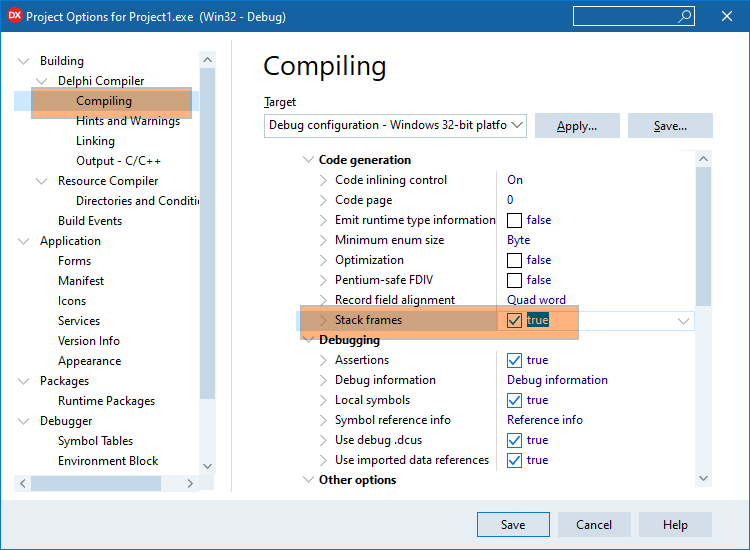
It is a good idea to make the compiler create stack frames.
Deleaker works with any code, even if it is built without stack frames. However, if the code is compiled with the use of stack frames, the information about call stacks is more complete.
To enable stack frames, click on Project - Project Options, go to Building - Delphi Compiler - Compiling and set Code generation - Stack frames to true:
If the application is built with the help of the command line, then in order to generate stack frames compiler switch -$W+ should be specified.
Disable optimization
More complete and correct information about leaks can be obtained by disabling optimization. Click on Project - Project Options, go to Building - Delphi Compiler - Compiling, set Code Generation - Optimization to false and Debugging - Use debug .dcus to true:
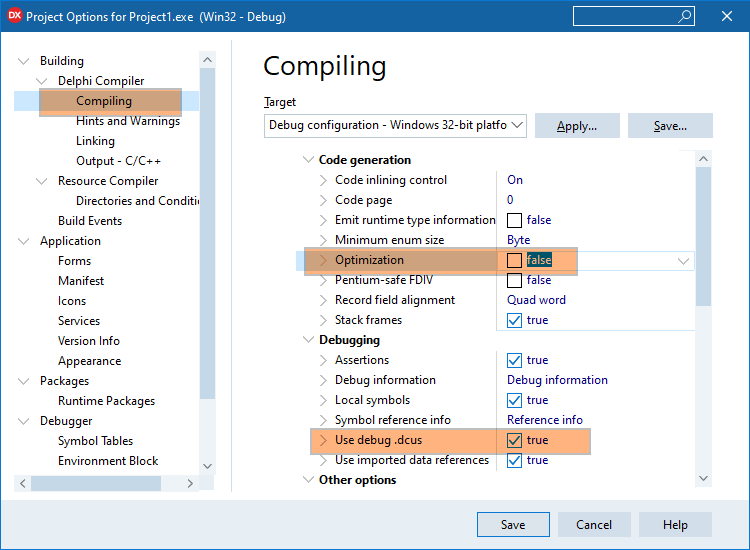
If the application is built with the help of the command line, then in order to disable optimization, compiler switch -$O- must be specified.
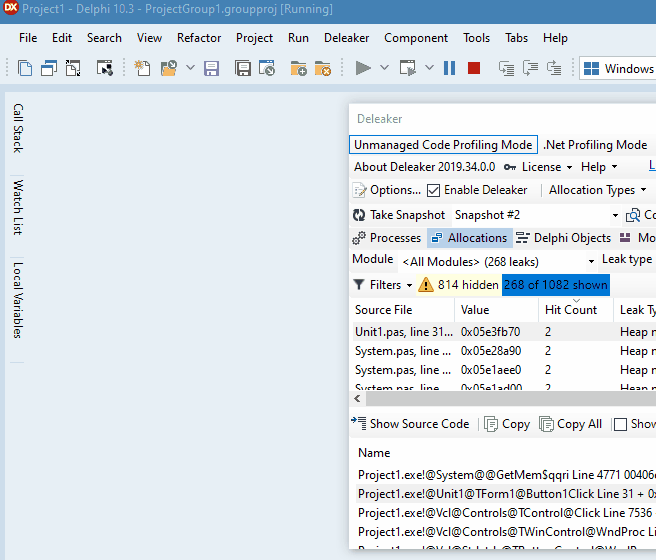
Taking a snapshot
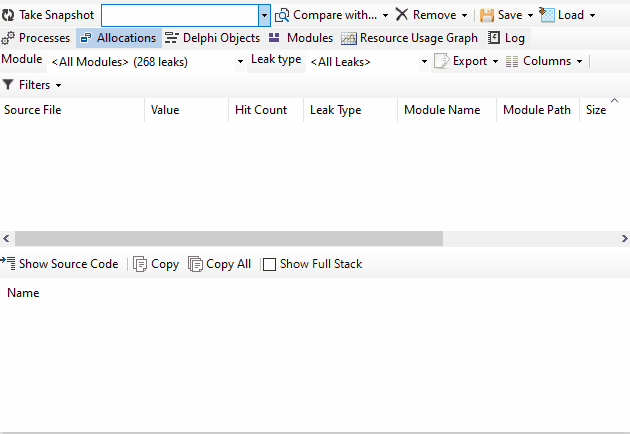
Start debugging and click on the button. Then go back to RAD Studio, click on the Deleaker - Deleaker Window and click on Take Snapshot to get a list of allocated resources: memory, handles, GDI resources, objects, etc.:
For each resource one can review its call stack, which allows to understand where in the code this resource was allocated. If information about the source file and line is available, Deleaker opens the source code in the editor by double-clicking (or through the context menu) :
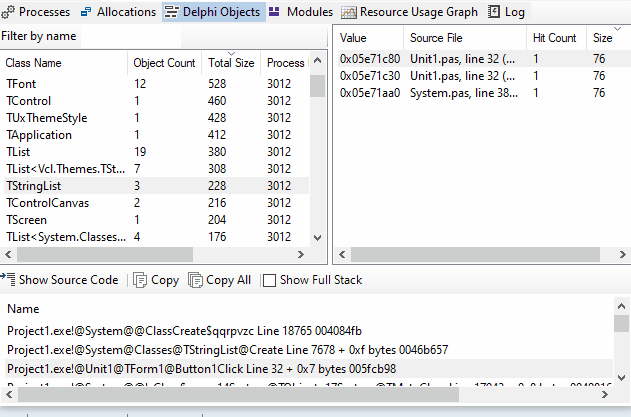
How to get a list of delphi objects?
On the Delphi Objects tab objects are grouped by class. For each class the list of objects of the following class is displayed. For each object its call stack is available:

You can quickly find a required class using Filter by name, just start typing:
Getting a list of leaks
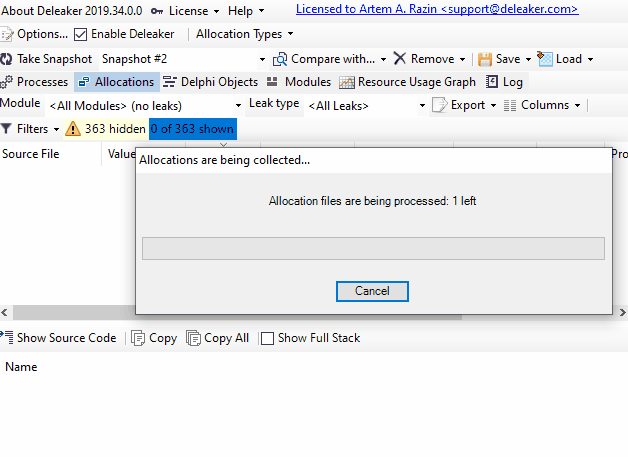
When the application exits, Deleaker automatically creates a snapshot that contains the list of leaks, i.e. all resources that have been allocated but not freed. After examining call stacks of each allocation and of each object, a developer can determine whether to free the resource explicitly or not:
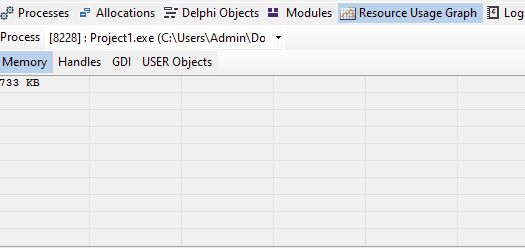
What if a process consumes more and more memory?
It happens that the memory, consumed by a process, is constantly increasing. In other case the handles count or GDI objects count is growing:
Let's see how to identify the source of the leak quickly.
For example, add a timer to periodically allocate memory:
procedure TForm1.Timer1Timer(Sender: TObject);
var
  p: Pointer;
  StringList: TStringList;
begin
  GetMem(p, 42);
  StringList := TStringList.Create;
end;
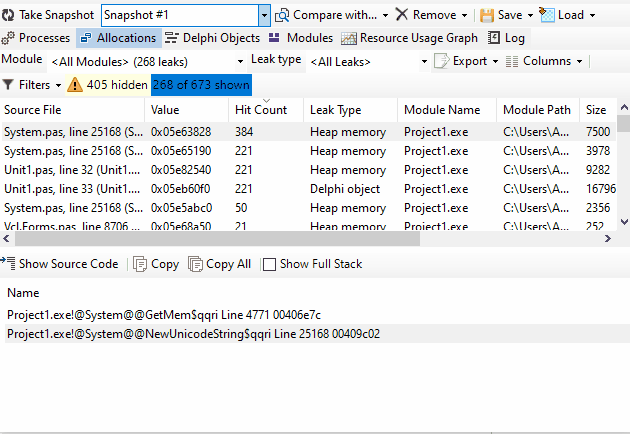
Pay attention to Hit Count
Deleaker groups all leaks by their call stack; the number of leaks that share the same call stack is shown in the Hit Count column. Thus, if memory is constantly allocated in the same place, the Hit Count will be permanently growing.
If objects of the same class are constantly being created, the value in the Object Count column will increase in the Delphi Objects tab.
It turns out that sorting by Hit Count and Object Count can quickly indicate problem areas in the code:
The second way: getting the difference between consecutive snapshots
However, sorting by Hit Count and Object Count does not allow to hide those resources that are "accumulating". There is another way to see only those resources that leak constantly.
First, the base snapshot is taken, and the process is given time to allocate more resources. Thus, there are two snapshots, and we are only interested in the resources that have been allocated since the base snapshot was taken. Select the base snapshot, click on Compare with... and click on the second snapshot so that Deleaker can calculate the difference between them.
Sometimes after comparing snapshots the list is empty. In this case clear all filters to see absolutely all allocations without exception.
The resulting list is cleaner:
Filters
Deleaker tries to show only those leaks that can be made by your program, filtering out the rest. For example, memory is allocated by system libraries, or some other code. If all the resources, allocated by a process, have been shown, it would be difficult to understand which of them is responsible for the code of your application.
To remind a developer that some leaks are hidden, Deleaker shows the number of hidden and displayed leaks to the right of the Filters button. With the help of this button you can quickly enable or disable filters:
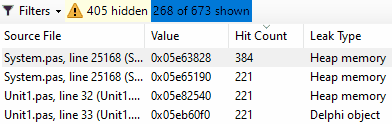
There are three types of filters:
Hide leaks with no source code - to hide leaks for which Deleaker was not able to find the source code.
Hide leaks from excluded modules - to hide leaks, made by code from modules, the list of which is in the Options - Exceptions - Excluded Modules. By default, these are system libraries.
Hide known leaks - to hide leaks, which are known probably, to be hopeless: they can be neither avoided nor fixed. These include, for example, one-time memory allocations by standard libraries. You can find a list of such leaks in the Options - Exceptions - Known Leaks.